Quartz Crystal MicroBalance (QCM)
Abstract
This project aims to construct a circuit that mimics a quartz crystal microbalance. This can be done via a combination of resistors, capacitors, and a quartz crystal. Testing of the QCM can be done by measuring the fundamental frequency of the quartz crystal oscillator, followed by adding a test mass such as the ink of a permanent marker on the oscillator to determine the frequency change. The original intention of building this QCM is to investigate if it is possible to measure the mass of thin films ex-situ. However, due to experimental and time constraints, we shall focus on building a circuit that can detect mass changes on the order of micrograms.
Team members
Tan Jhoon Yong
Idea
Quartz crystal microbalance (QCM) is widely used to measure mass changes to substances involved in physical and chemical processes. In my field of research, we often have to find out the thicknesses of thin films as part of the process of characterizing the samples. There are a few methods that are usually employed in my research to measure thin films' thicknesses such as observing the reflection high-energy electron diffraction (RHEED) oscillations during pulsed-laser deposition (PLD), atomic force microscopy (AFM), X-ray diffraction (XRD) (if the sample is ordered), and fitting of data from spectroscopic ellipsometry (SE). These techniques usually expend a significant amount of time but provide an accurate value to the thickness measurements. Creating a QCM that can work ex-situ will assist my research, and also serves as a reference point and hastens the process of fitting models in SE analysis.
Many of the developments and features that exist in today’s commercial QCM instruments were pioneered in laboratories with custom-built instruments to meet specific research needs, such as the use of internal reference crystals to separate the effects of a liquid environment from those of a film sample.
Working Principle
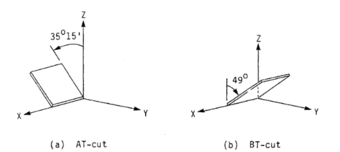
The working principle behind the QCM is based on the piezoelectric effect. The piezoelectric effect is the generation of electric charges by a crystalline material upon subjecting it to stress.[1] An oscillating electric field applied across the device induces an acoustic wave that propagates through the crystal and meets minimum impedance when the device's thickness is a half-integer multiple of the wavelength of the acoustic wave.[2] It is a shear mode device in which the acoustic wave propagates in a direction perpendicular to the crystal surface.[3] Therefore, crystals cut in specific crystal axes have to be used to utilize the shear mode. A resonant oscillation in the crystal is achieved by putting the crystal in an oscillation circuit where the electrical and mechanical oscillations are close to the fundamental frequency of the crystal. Changes to the mass of the crystal would result in a proportional change in its natural frequency according to the Sauerbrey equation[4]
where is the change in resonance frequency, is the specific sensitivity of the crystal, is the mass adsorbed on the active area, and is the harmonic number. describes how much material per unit area is required to change the resonant frequency of the crystal by 1Hz. A smaller value gives a higher mass sensitivity. This value depends on the fundamental resonant frequency of the crystal, and it is defined as
where is the thickness of the quartz, is the density of the quartz plate, and f0 is the fundamental resonant frequency of quartz. With these, we can determine the mass of the deposited material.
Another consideration would be the energy dissipation of the crystal to the surroundings. This is important, especially for viscoelastic films. Viscoelastic films violate the Sauerbrey condition that the bound mass is rigidly attached to the crystal without any slip. Such viscoelastic films dissipate energy via mechanical losses in the flexible mass.
Setup
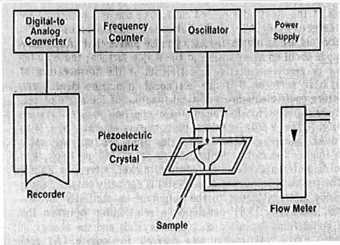
The typical QCM set-up of piezoelectric quartz crystal microbalance is shown in Figure 2. The oscillator circuit is connected to the power supply and sample stage mount where the piezoelectric quartz crystal is. We can determine the resonance frequency of the quartz crystal using an oscilloscope, frequency counter, or spectrum analyzer.
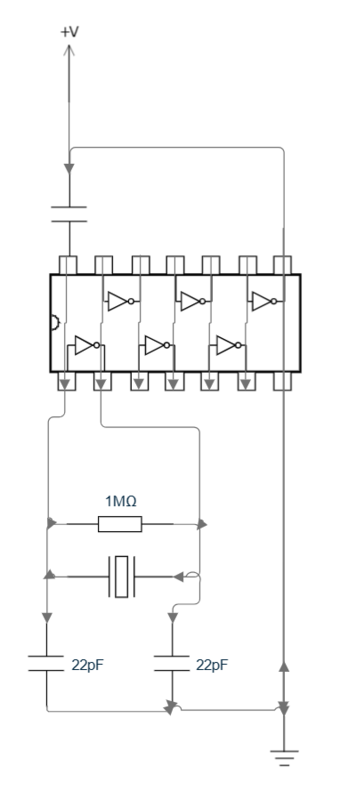
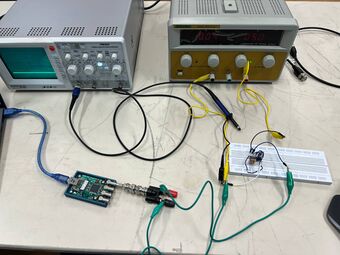
To determine the feasibility of this QCM project, we built a simple oscillating circuit as a foundation to test if we can detect the resonance frequency of the quartz crystal. This also serves as a time buffer while waiting for the AT-cut quartz to be delivered. Figures 3 and 4 show the electrical circuit diagram and its implementation on a breadboard respectively.
As the electrical current generated from the oscillation of the quartz crystal is an alternating current due to the piezoelectric effect, we employ the usage of logic gates called inverters to convert DC to AC for readout. Adding a resistor to the circuit allows for the control of the potential difference across the inverter. In this oscillating circuit, we use a 14-pin integrated circuit and measure the resonant frequency of a CMAC CK q5 crystal oscillator.
Measurements
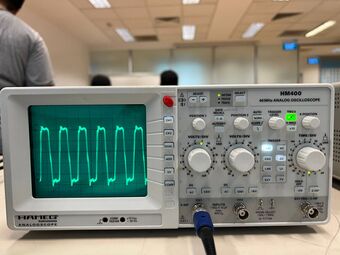
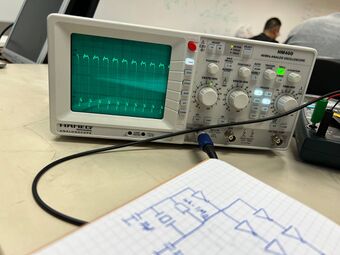
A DC power supply of 5V is given and an oscilloscope is connected to see the signal's waveform. A frequency counter is connected to the electrical circuit and communicated to my computer via the Arduino Integrated Development Environment. The frequency is measured for 10 seconds 10 times to get an average. Eventually, a resonant frequency of 10.000001Mhz is recorded, which is very close to the 10Mhz value that was provided by the manufacturer.
The waveform seen on the oscilloscope is observed to be periodic and looks like a square-wave oscillation. There seem to be additional peaks periodically formed as well, which could likely come from circuit impedance mismatches. Mismatches in impedance between different components or sections of a circuit can cause signal reflections and distortions, leading to additional peaks in the waveform. We would have to adjust the values of the capacitors and resistors.
Then, we replace the 10Mhz crystal oscillator with the AT-cut crystal. Although we managed to obtain the frequency signal generated by the AT-cut crystal, the surface of the crystal is very sensitive such that waving your hands near the oscillator causes the waveform to change. To make the signal more stable, we construct another circuit design similar to the Colpitts oscillator.[5] One of the advantages of using this layout is that relatively low phase noise can be achieved, making them suitable for applications requiring stable and low-noise oscillation.
Second Set-Up
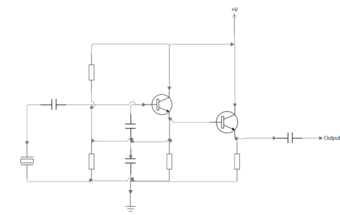
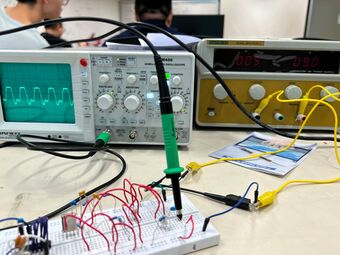
The circuit design and the actual circuit are shown in Figures 7 and 8. 2N2222 bipolar junction transistors were used with a combination of capacitors and resistors. The purpose of the transistor is to amplify the voltage across the resonant circuit and stabilize the oscillations through a feedback loop. A DC power supply of 9V is applied across the circuit and an oscilloscope is connected to observe the waveform. Figure 8 shows the waveform, which seems to be a superposition of a square wave and another periodic signal which could be due to the aforementioned circuit impedance mismatches.
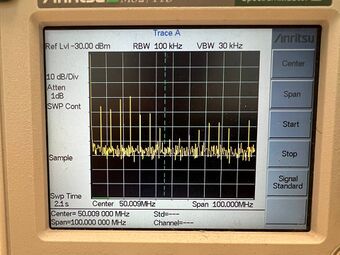
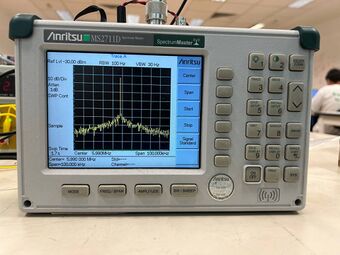
We use the Anritsu MS2711D Spectrum Master to look for the resonance frequencies as a cross-reference to the frequency counter measurement. In Figure 9, the resonance frequency of the piezoelectric quartz oscillator and its higher-order harmonics are shown. From the wide scan, we can see that the zeroth-order overtone occurs at approximately 6Mhz, and the higher-order harmonics occur in multiple integers of 6MHz.
Second Measurement
The procedure for the frequency counter measurements is the same as that of the 10MHz crystal oscillator. The fundamental resonant frequency is measured to be 5.986804MHz. Using this as the reference resonance frequency, we can now test its effectiveness in mass measurements with the Sauerbrey equation.
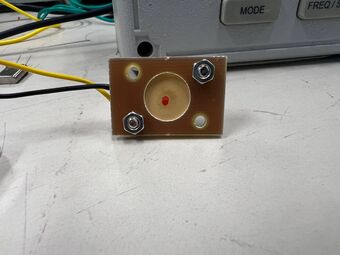
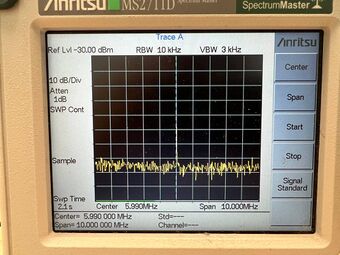
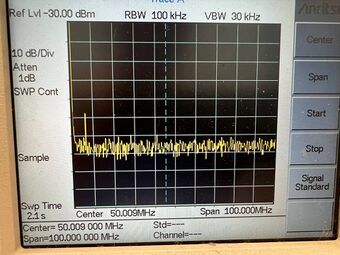
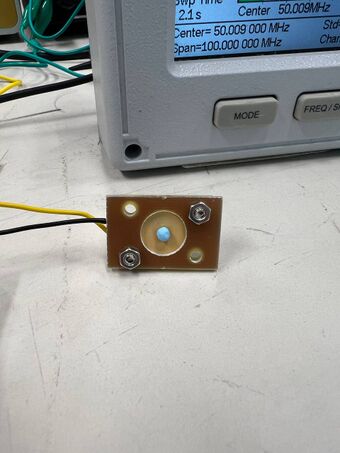
Firstly, a permanent marker is used where we dot the center of the quartz crystal shown in Figure 11. [insert permanent marker ink] Initially, there was no signal shown in Figure 12. This is most likely due to the damping of the resonance oscillations due to the added mass, thereby decreasing the voltage gain. However, increasing the DC supply voltage sufficiently allows the fundamental mode to be observed as shown in Figure 13. We repeated the frequency counter measurements and found the new resonance frequency to be 5.984613MHz.
To test the mass limit of this setup, a small Blu Tack weighing 2.1 grams is placed on the center of the oscillator. A new oscillator is used so that the dried ink does not interfere with the measurement. The Spectrum Master did not record any spectral features, which suggests that the oscillation of the crystal is too damped to be detected and that the gain is insufficient. Increasing the DC power supply to 18V is inadequate to produce a spectral feature. For safety purposes, this will be the limit that we shall test.
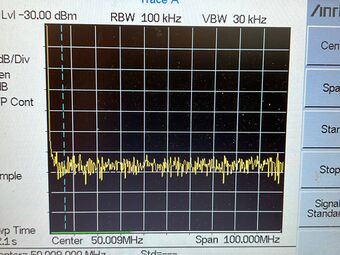
Based on the Sauerbrey equation, the decrease in resonance frequency of 2191Hz corresponds to an increase in mass of 969 micrograms. This value is derived by using the following:
- thickness of quartz crystal plate mm
- density of quartz crystal kg m-3
- fundamental resonance frequency of quartz crystal plate MHz
To understand how accurate this measurement is, let us approximate the volume of ink to be a drop of water and calculate how much a drop of water weighs. We assume that the density of the marker ink is approximately similar to water. A drop of water of 0.1ml is approximately 100 micrograms. This shows that the measurement is about an order of magnitude higher than the approximation.
This huge error arises because of the assumptions of using the Sauerbrey equation. The Sauerbrey equation is valid under the following conditions:
- The added mass is small compared to the mass of the crystal
- The added mass is rigidly adsorbed onto the surface of the crystal
- The mass is evenly distributed over the active area of the crystal.
Based on these conditions, the second and third conditions are not fulfilled. In the next section, we discuss what are how these assumptions can be relaxed.
Potential Improvements and Conclusion
Some better models describe the relationship between frequency change and mass adsorbed where we consider the added mass to be viscoelastic. The Sauerbrey equation fails to describe viscoelastic films on the quartz oscillator as the condition where the added mass is rigidly bound is not adhered to. This model is called the QCM-D, where D refers to the energy dissipation by the film. This technique is prevalent in the fields of lipids, proteins, nanoparticles, etc.[6] However, this requires the use of liquid media.
To conclude, we managed to detect the quartz crystal oscillation with a simple circuit design. Changes in resonance frequency due to added mass can also be detected, but the margin of error is too large for it to be usable for research purposes. Future improvements to this experiment can be done by adopting energy dissipation within our considerations.
References
- ↑ Meissner A (1927) € Uber piezoelectrische Krystalle bei Hochfrequenz. Z Tech Phys 8:74
- ↑ O’Sullivan, C. K., & Guilbault, G. G. (1999). Commercial quartz crystal microbalances – theory and applications. Biosensors and Bioelectronics, 14(8), 663–670.
- ↑ Ebersole, R., Miller, J., Moran, J., & Ward, M. (1990). PZ quartz sensors for use in clinical analysis. J. Am. Chem. Soc, 112, 3239.
- ↑ Sauerbrey, G. (1959). Verwendung von Schwingquarzen zur Wägung dünner Schichten und zur Mikrowägung. Zeitschrift für Physik, 155(2), 206–222.
- ↑ US 1624537, Colpitts, Edwin H., "Oscillation generator", published 1 February 1918, issued 12 April 1927
- ↑ Chen, Q., Xu, S., Liu, Q., Masliyah, J., & Xu, Z. (2016). QCM-D study of nanoparticle interactions. Advances in Colloid and Interface Science, 233, 94–114.


