Optical Sensor for Noise Flickering
Group Members
Eric Cheung Jun Hao; Lee An Min, Amanda; Loh Jia Ying Whitney
Background and Introduction
The objective of this project is to characterise a given photodiode and to successfully determine the frequency of an unknown flickering light source.
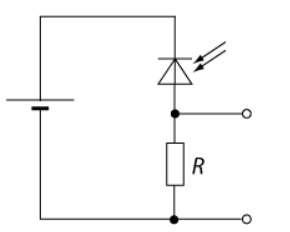
With a simple potential divider, consisting a resistor and a photodiode in series, the resistance and hence sensitivity of the photodiode can be determined. By exposing the photodiode to visual noise tags, such as the flickering of LEDs, the resistance across the photodiode is expected to decrease and hence, a larger potential can be measured across the resistor. The photodiode resistance is a function of light exposure. The resistance is inversely proportional to light intensity. The output can be observed on an oscilloscope to determine the performance of the photodiode.
Set-Up
Equipment Needed
| S/N | Item | Description/Model No. |
|---|---|---|
| 1 | Soldering Iron | - |
| 2 | Soldering Tin | - |
| 3 | Wires | - |
| 4 | Resistors | 10k, 100k, 500k, 1M, 10M |
| 5 | LDR Photoresistor | GL5528 / GL5537 |
| 6 | DC Power Supply | Matrix MPS-3005L-3 |
| 7 | Signal Generator | Agilent 33220A |
| 8 | 40 MHz Analog Oscilloscope | Hameg HM400 |
| LED S/N | Colour | Wavelength (nm) | Size (mm) |
|---|---|---|---|
| 1 | Red | 643 | 5 |
| 2 | Orange | 625 | 5 |
| 3 | Amber | 605 | 5 |
| 4 | Green | 570 | 5 |
| 5 | Blue | - | 5 |
| 6 | Red | 650 | 3 |
| 7 | Orange | 625 | 3 |
| 8 | Green | 570 | 3 |
| 9 | Blue | - | 3 |
Experimental Set-up
Circuit Design
A signal generator is used to pulse the LEDs to create a flickering light source. A square wave with a peak-to-peak voltage of 2V is used across all the measurements taken. A DC power supply is used to supply 3V across the photodiode.
Variables
The performance of the photodiode will be determined by varying the following parameters: 1. Wavelength of LED 2. Resistor in circuit 3. Frequency of blinking (1Hz - 100kHz)
The dependent variables that will be measured are: 1.
This will allow us to determine the following parameters: 1. Efficiency (Time decay) of photodiode at different wavelengths
Timeline and Milestone
| Week | Dates | Tasks |
|---|---|---|
| Week 7 | 4 - 8 Mar | Collecting equipment and prelimary set-up |
| Week 8 | 11 - 15 Mar | Complete circuit set-up and prelimary measurements |
| Week 9 | 18 - 22 Mar | Data collection (vary LEDs) |
| Week 10 | 25 - 29 Mar [Well-being day (28 Mar), Good Friday (29 Mar)] | Data collection (vary resistance) |
| Week 11 | 1 - 5 Apr | Data Analysis and further measurements (if needed) |
| Week 12 | 8 - 12 Apr [Hari Raya (10 Apr)] | Data Analysis and explore other light sources (phone/computer screens) |
| Week 13 | 15 - 19 Apr | Analyse experimental results and complete documentation |
Results
Characterization of the photodiode is done with three 5 mm LEDs: (i) red, 643nm; (ii) green, 570nm; and (iii) blue, 450nm to 495nm. It can be noted that the photodiode sensitivity increases with increasing wavelength of LED used.
The photodiode used in this experiment is Hamamatsu S5972 Si PIN photodiode. According to the datasheet, it has a spectral response range between 320nm to 1000nm, with a peak sensitivity at 800nm, near infrared radiation. The cutoff frequency is 0.5GHz at reverse bias of 10V. The terminal capacitance at reverse bias of 2V is close to 3pF.
From experimental results,
Out of the three LEDs used, the signal from the green LED is the noisiest. Powering the three LEDs reveals that with a constant voltage supplied, the green LED is the dimmest.
[insert image]
The experimentally-determined rise time of the photodiode with the 5 mm red LED is approximately 0.3ms with a series resistance of 100kΩ. And the time constant of the photodiode with a series resistance of 100kΩ is ___. Thus, the internal capacitance of the photodiode is calculated to be ___.
