High Sensitive Position Sensor based on PDH technique
Team members
Angela Anna Baiju and Chenyue Gu
Idea
This project is aiming of using Pound–Drever–Hall (PDH) technique to sense the vibration and the movement of the mirror driven by the noise from the environment (acoustic, thermal, etc.).
Pound–Drever–Hall laser frequency stabilisation is a powerful technique providing a means to stabilise the frequency of a laser to a specific reference frequency. It is commonly employed in precision measurements and experimental setups where precise control over the laser frequency is required, such as interferometric gravitational-wave detector. Alternatively, if a stable laser is available, the PDH technique can be used to stabilise and/or measure the instabilities in an optical cavity length via the error signal readout from the cavity.
In this project, we will lock the cavity by reading the error signal of reflection/transmission of the cavity and then feed it back to the input mirror, moving the mirror with a PZT. And then we can read out the cavity length change from the error signal. This sensing technique is commonly using in LIGO-Virgo-KAGRA (LVK) interferometric gravitational wave detection community, as well as quantum optomechnics.
Pound-Drever-Hall Method
The idea behind the PDH method is simple: A laser’s frequency is measured with a Fabry–Perot cavity, either transmission or reflection, and then is fed back to the input laser to suppress frequency fluctuations. The process begins with modulating the laser light. This is typically achieved by imposing a high-frequency (radio frequency or microwave) signal onto the laser beam (Local Oscillator). This modulation creates sidebands around the carrier frequency of the laser light. These sidebands are symmetrically spaced around the carrier frequency. The modulated laser light then passes through an electro-optic modulator (EOM). The EOM applies phase modulation to the light, causing the sidebands to shift in frequency relative to the carrier frequency. The amount of phase modulation applied determines the frequency separation between the carrier and the sidebands. The phase-modulated laser light is directed onto a frequency reference, which can be a stable Fabry–Perot cavity. The reflected beam is then picked off and compared with the local oscillator's signal via a mixer whose output is the product of its inputs. From the output of the mixer, by using a low-pass filter, the dc (or very low frequency) part which is of interest remains and the ac (or high frequency) part that is usually the twice the modulation frequency is filtered out. The remaining dc signal, so called error signal, then goes through the feedback loop. The feedback loop typically involves a control mechanism, such as adjusting the current supplied to the laser diode or controlling the frequency of the modulation signal. The feedback loop aims to minimise the error signal by stabilising the laser frequency to match the reference frequency. A basic setup of PDH method is shown in Fig. 1 [1].

Fig. 1 A basic diagram of the setup implementing Pound-Drever-Hall method. In this digram, the laser frequency is modulated with a Pockels cell, driven by some local oscillator. The reflected beam is picked off with an optical isolator (a polarising beamsplitter and a quarter-wave plate makes a good isolator) and sent into a photodetector, whose output is compared with the local oscillator’s signal via a mixer. A low-pass filter on the output of the mixer isolates this low frequency signal, which then goes through a servo am- plifier and into the tuning port on the laser, locking the laser to the cavity. The Faraday isolator keeps the reflected beam from getting back into the laser and destabilizing it.
To implement the method, we need to know well about how to process the error signal, which is the heart of the technique. We follow the derive from Eric D. Black's paper [2], and run simulation by Python.
Reflection of a monochromatic beam from a Fabry-Perot cavity
To start the math behind it, we pick a point outside the cavity and measure the electric field over time. Then the magnitude of the electric field of the incident and the reflected beams can be written as
Failed to parse (SVG (MathML can be enabled via browser plugin): Invalid response ("Math extension cannot connect to Restbase.") from server "https://wikimedia.org/api/rest_v1/":): {\displaystyle E_{in} = E_{0}e^{i\omega t}} ,
Failed to parse (SVG (MathML can be enabled via browser plugin): Invalid response ("Math extension cannot connect to Restbase.") from server "https://wikimedia.org/api/rest_v1/":): {\displaystyle E_{re} = E_{1}e^{i\omega t}} ,
where Failed to parse (SVG (MathML can be enabled via browser plugin): Invalid response ("Math extension cannot connect to Restbase.") from server "https://wikimedia.org/api/rest_v1/":): {\displaystyle \omega} is the incident laser frequency, Failed to parse (SVG (MathML can be enabled via browser plugin): Invalid response ("Math extension cannot connect to Restbase.") from server "https://wikimedia.org/api/rest_v1/":): {\displaystyle E_{0}} and are complex, and in this way, we account for the relative phase between the two waves in. The reflection coefficient Failed to parse (SVG (MathML can be enabled via browser plugin): Invalid response ("Math extension cannot connect to Restbase.") from server "https://wikimedia.org/api/rest_v1/":): {\displaystyle F(\omega)} is thus given by

Failed to parse (SVG (MathML can be enabled via browser plugin): Invalid response ("Math extension cannot connect to Restbase.") from server "https://wikimedia.org/api/rest_v1/":): {\displaystyle F(\omega) = E_{re}/E_{in} = \frac{r\left(e^{i\frac{\omega}{ \Delta \nu_{FSR}}}-1\right)}{1-r^2e^{i\frac{\omega}{\Delta \nu_{FSR}}}}} .
Here we consider a lossless and symmetric Fabry-Perot cavity formed with two mirrors whose amplitude reflection coefficient are both Failed to parse (SVG (MathML can be enabled via browser plugin): Invalid response ("Math extension cannot connect to Restbase.") from server "https://wikimedia.org/api/rest_v1/":): {\displaystyle r} . The free spectral range of the cavity is denoted as Failed to parse (SVG (MathML can be enabled via browser plugin): Invalid response ("Math extension cannot connect to Restbase.") from server "https://wikimedia.org/api/rest_v1/":): {\displaystyle \Delta \nu_{FSR} = c/2L} .

Fig. 2 Magnitude and phase of the reflection coefficient for a Fabry-Perot cavity. The finesse is different for the figure of different rows. According to different Failed to parse (SVG (MathML can be enabled via browser plugin): Invalid response ("Math extension cannot connect to Restbase.") from server "https://wikimedia.org/api/rest_v1/":): {\displaystyle r = 0.99 , 0.90 , 0.75} , from the top row the the bottom row, the figures show the reflection coefficient for cavities of fitness equals to Failed to parse (SVG (MathML can be enabled via browser plugin): Invalid response ("Math extension cannot connect to Restbase.") from server "https://wikimedia.org/api/rest_v1/":): {\displaystyle 312.58} , Failed to parse (SVG (MathML can be enabled via browser plugin): Invalid response ("Math extension cannot connect to Restbase.") from server "https://wikimedia.org/api/rest_v1/":): {\displaystyle 29.80} , and respectively. Note the discontinuity in phase (the straight line around Failed to parse (SVG (MathML can be enabled via browser plugin): Invalid response ("Math extension cannot connect to Restbase.") from server "https://wikimedia.org/api/rest_v1/":): {\displaystyle \omega /\Delta \nu_{FSR} = 2\pi} ), caused by the reflected power vanishing at resonance.

Noted that Failed to parse (SVG (MathML can be enabled via browser plugin): Invalid response ("Math extension cannot connect to Restbase.") from server "https://wikimedia.org/api/rest_v1/":): {\displaystyle F(\omega + 2\pi n \Delta \nu_{FSR}) = F(\omega)} , so the cavity has infinite resonant frequencies at Failed to parse (SVG (MathML can be enabled via browser plugin): Invalid response ("Math extension cannot connect to Restbase.") from server "https://wikimedia.org/api/rest_v1/":): {\displaystyle \omega_{c} = 2\pi n \Delta \nu_{FSR}} (where Failed to parse (SVG (MathML can be enabled via browser plugin): Invalid response ("Math extension cannot connect to Restbase.") from server "https://wikimedia.org/api/rest_v1/":): {\displaystyle n} is an integer), and here we just plot the reflection coefficient around one cavity resonance as an example.
Modulating the beam: sidebands and the error signal
As shown in figure 2, when the frequency of the incident beam is detuned away from the resonance (Failed to parse (SVG (MathML can be enabled via browser plugin): Invalid response ("Math extension cannot connect to Restbase.") from server "https://wikimedia.org/api/rest_v1/":): {\displaystyle \omega / \Delta \nu_{FSR} > 2n\pi} or Failed to parse (SVG (MathML can be enabled via browser plugin): Invalid response ("Math extension cannot connect to Restbase.") from server "https://wikimedia.org/api/rest_v1/":): {\displaystyle \omega / \Delta \nu_{FSR} < 2n\pi} ), one can not tell the difference between blue- (higher frequency) and red-(lower frequency) detuning by looking at the magnitude (intensity) of the reflection coefficient. This is because the magnitude of the reflection coefficient is symmetric about the cavity resonant frequency. However, the phase profile near the resonance does not have this feature. Instead, it has a huge change and is discontinuous. Thus, to tell whether the laser's frequency is above or below the cavity resonance, we need to measure the phase of the reflected beam. In order to do so, we need to modulate the beam and generate sidebands with a definite phase relationship to the incident and reflected beams. After interfering these sidebands with the reflected beam, we will get a beat pattern at the modulation frequency, which gives the information of the phase of the reflected beam.
Creating the sidebands
Now, we apply a phase modulation on the input field, and we can write its electric field as
Failed to parse (SVG (MathML can be enabled via browser plugin): Invalid response ("Math extension cannot connect to Restbase.") from server "https://wikimedia.org/api/rest_v1/":): {\displaystyle E_{in} = E_0 e^{i(\omega t + \beta sin \Omega t)}} ,
where Failed to parse (SVG (MathML can be enabled via browser plugin): Invalid response ("Math extension cannot connect to Restbase.") from server "https://wikimedia.org/api/rest_v1/":): {\displaystyle \Omega} is the modulation frequency, and is the modulation depth. Thus, we can write the expansion of this expression with Bessel function as

Failed to parse (SVG (MathML can be enabled via browser plugin): Invalid response ("Math extension cannot connect to Restbase.") from server "https://wikimedia.org/api/rest_v1/":): {\displaystyle E_{in}\approx \left[ J_0(\beta)+2iJ_1(\beta)sin\Omega t \right]e^{i\omega t} = E_0\left[J_0(\beta)e^{i\omega t}+J_1(\beta)e^{i(\omega+\Omega)t}-J_1(\beta)e^{i(\omega-\Omega)t} \right]} .
It shows that after the modulation, there are actually three different beams incident on the cavity: a carrier with angular frequency of Failed to parse (SVG (MathML can be enabled via browser plugin): Invalid response ("Math extension cannot connect to Restbase.") from server "https://wikimedia.org/api/rest_v1/":): {\displaystyle \omega} and two sidebands with frequencies of Failed to parse (SVG (MathML can be enabled via browser plugin): Invalid response ("Math extension cannot connect to Restbase.") from server "https://wikimedia.org/api/rest_v1/":): {\displaystyle \omega\pm\Omega} . And if we denote the total power of the incident beam as Failed to parse (SVG (MathML can be enabled via browser plugin): Invalid response ("Math extension cannot connect to Restbase.") from server "https://wikimedia.org/api/rest_v1/":): {\displaystyle P_0\equiv |E_0|^2} , the power of the carrier and the first-order sidebands can be written as
Failed to parse (SVG (MathML can be enabled via browser plugin): Invalid response ("Math extension cannot connect to Restbase.") from server "https://wikimedia.org/api/rest_v1/":): {\displaystyle P_c=J^2_0(\beta)P_0} ,
.

With a small modulation depth (Failed to parse (SVG (MathML can be enabled via browser plugin): Invalid response ("Math extension cannot connect to Restbase.") from server "https://wikimedia.org/api/rest_v1/":): {\displaystyle \beta <1} ), we can assume all the power is in the carrier and the first-order sidebands (Failed to parse (SVG (MathML can be enabled via browser plugin): Invalid response ("Math extension cannot connect to Restbase.") from server "https://wikimedia.org/api/rest_v1/":): {\displaystyle P_c + 2P_s\approx P_0} ).
Measuring the error signal
After modulation, the total reflection is written as the sum of the reflection of the carrier and two sidebands
Failed to parse (SVG (MathML can be enabled via browser plugin): Invalid response ("Math extension cannot connect to Restbase.") from server "https://wikimedia.org/api/rest_v1/":): {\displaystyle E_{re}=E_0\left[F(\omega)J_0(\beta)e^{i\omega t} + F(\omega+\Omega) J_1 (\beta) e^{i(\omega+\Omega)t} - F(\omega-\Omega) J_1 (\beta) e^{i(\omega-\Omega)t} \right]}
And the power of the reflected beam can then be obtained as
Failed to parse (SVG (MathML can be enabled via browser plugin): Invalid response ("Math extension cannot connect to Restbase.") from server "https://wikimedia.org/api/rest_v1/":): {\displaystyle P_{re}=|E_{re}|^2=P_c|F(\omega)|^2+P_s \left[ |F (\omega+\Omega)|^2 + |F (\omega-\Omega)|^2 \right] }
Failed to parse (SVG (MathML can be enabled via browser plugin): Invalid response ("Math extension cannot connect to Restbase.") from server "https://wikimedia.org/api/rest_v1/":): {\displaystyle ~ ~ + 2\sqrt{P_c P_s} \left[ \mathcal{Re} \left( F(\omega) F^*(\omega+\Omega) - F^*(\omega) F(\omega-\Omega) \right) cos \Omega t + \mathcal{Im} \left( F(\omega) F^*(\omega+\Omega) - F^*(\omega) F(\omega-\Omega) \right) sin \Omega t \right]}
Failed to parse (SVG (MathML can be enabled via browser plugin): Invalid response ("Math extension cannot connect to Restbase.") from server "https://wikimedia.org/api/rest_v1/":): {\displaystyle ~ ~ ~ + (2 \Omega~term)} ,
where we show the production of the three different frequencies, the carrier at Failed to parse (SVG (MathML can be enabled via browser plugin): Invalid response ("Math extension cannot connect to Restbase.") from server "https://wikimedia.org/api/rest_v1/":): {\displaystyle \omega} and the upper and the lower sidebands at Failed to parse (SVG (MathML can be enabled via browser plugin): Invalid response ("Math extension cannot connect to Restbase.") from server "https://wikimedia.org/api/rest_v1/":): {\displaystyle \omega \pm \Omega} . We ignored the Failed to parse (SVG (MathML can be enabled via browser plugin): Invalid response ("Math extension cannot connect to Restbase.") from server "https://wikimedia.org/api/rest_v1/":): {\displaystyle 2\Omega} term which comes from the sidebands interfering with each other.
As shown in the equation, we get dc components related to the carrier and the two sidebands frequencies, and a sine term and a cosine term oscillating at the modulation frequency. We are interested in the oscillating terms because they carry the information of the phase of the reflected carrier. And we will see in the following, usually, at low modulation frequencies only the cosine term survives, and at high modulation frequencies, only the sine term is important.
Now we multiply the reflection signal with the modulation frequency (Failed to parse (SVG (MathML can be enabled via browser plugin): Invalid response ("Math extension cannot connect to Restbase.") from server "https://wikimedia.org/api/rest_v1/":): {\displaystyle sin\Omega t} ) with a mixer, we get
Failed to parse (SVG (MathML can be enabled via browser plugin): Invalid response ("Math extension cannot connect to Restbase.") from server "https://wikimedia.org/api/rest_v1/":): {\displaystyle P_{mix}= P_{re} sin\Omega t=P_I+P_{dc}sin\Omega t - \frac{1}{2}P_I cos2\Omega t} ,
where
Failed to parse (SVG (MathML can be enabled via browser plugin): Invalid response ("Math extension cannot connect to Restbase.") from server "https://wikimedia.org/api/rest_v1/":): {\displaystyle P_{dc}= P_c|F(\omega)|^2+P_s \left[ |F (\omega+\Omega)|^2 + |F (\omega-\Omega)|^2 \right]} ,
Failed to parse (SVG (MathML can be enabled via browser plugin): Invalid response ("Math extension cannot connect to Restbase.") from server "https://wikimedia.org/api/rest_v1/":): {\displaystyle P_I= 2\sqrt{P_c P_s} \mathcal{Im} \left( F(\omega) F^*(\omega+\Omega) - F^*(\omega) F(\omega-\Omega) \right)} ,
and we see in the mixed signal, the cosine term in the reflection is totally vanished. So in order to gain the information from the cosine term, we need to turn the sine signal into a cosine signal, so we can simply adding Failed to parse (SVG (MathML can be enabled via browser plugin): Invalid response ("Math extension cannot connect to Restbase.") from server "https://wikimedia.org/api/rest_v1/":): {\displaystyle \pi/2} a phase shift, which can we achieved by a phase shifter or a delay line.
Then we will get
Failed to parse (SVG (MathML can be enabled via browser plugin): Invalid response ("Math extension cannot connect to Restbase.") from server "https://wikimedia.org/api/rest_v1/":): {\displaystyle P_{mix}= P_{re} cos\Omega t = P_R + P_{dc} cos\Omega t + \frac{1}{2}P_R cos2\Omega t} ,
where
Failed to parse (SVG (MathML can be enabled via browser plugin): Invalid response ("Math extension cannot connect to Restbase.") from server "https://wikimedia.org/api/rest_v1/":): {\displaystyle P_R= 2\sqrt{P_c P_s} \mathcal{Re} \left( F(\omega) F^*(\omega+\Omega) - F^*(\omega) F(\omega-\Omega) \right)} .
After the mixer, the information in the cosine and sine terms in the reflection signal are now become the only dc signal in the mixed signal. Then we can isolate them with a low-pass filter.
Fast modulation near resonance
In the regime when the carrier is near resonance and the modulation frequency is high enough (Failed to parse (SVG (MathML can be enabled via browser plugin): Invalid response ("Math extension cannot connect to Restbase.") from server "https://wikimedia.org/api/rest_v1/":): {\displaystyle \Omega \gg \Delta \nu_{FSR} / \mathcal{F}} ) that the sidebands are not, we can assume that the sidebands are totally reflected that Failed to parse (SVG (MathML can be enabled via browser plugin): Invalid response ("Math extension cannot connect to Restbase.") from server "https://wikimedia.org/api/rest_v1/":): {\displaystyle F(\omega \pm \Omega) \approx -1} . Thus
Failed to parse (SVG (MathML can be enabled via browser plugin): Invalid response ("Math extension cannot connect to Restbase.") from server "https://wikimedia.org/api/rest_v1/":): {\displaystyle F(\omega) F^*(\omega+\Omega) - F^*(\omega) F(\omega-\Omega) \approx -i2\mathcal{Im}[F(\omega)]} ,
is purely imaginary. In this regime, we mixed the reflection signal with the in-phase modulation signal and get the error signal as
Failed to parse (SVG (MathML can be enabled via browser plugin): Invalid response ("Math extension cannot connect to Restbase.") from server "https://wikimedia.org/api/rest_v1/":): {\displaystyle \epsilon = P_I = 2\sqrt{P_c P_s} \mathcal{Im} \left( F(\omega) F^*(\omega+\Omega) - F^*(\omega) F(\omega-\Omega) \right) } .
Figure 3 shows a plot of this error signal.

Figure 3. Error signal with high frequency modulation. From left to right, the figures show the error signal for cavities of fitness equals to Failed to parse (SVG (MathML can be enabled via browser plugin): Invalid response ("Math extension cannot connect to Restbase.") from server "https://wikimedia.org/api/rest_v1/":): {\displaystyle 312.58} , Failed to parse (SVG (MathML can be enabled via browser plugin): Invalid response ("Math extension cannot connect to Restbase.") from server "https://wikimedia.org/api/rest_v1/":): {\displaystyle 29.80} , and Failed to parse (SVG (MathML can be enabled via browser plugin): Invalid response ("Math extension cannot connect to Restbase.") from server "https://wikimedia.org/api/rest_v1/":): {\displaystyle 10.88} respectively.
Slow modulation
When the modulation signal is very slow (Failed to parse (SVG (MathML can be enabled via browser plugin): Invalid response ("Math extension cannot connect to Restbase.") from server "https://wikimedia.org/api/rest_v1/":): {\displaystyle \Omega \ll \Delta \nu_{FSR} / \mathcal{F}} ), we get the instantaneous frequency of the modulated beam as
Failed to parse (SVG (MathML can be enabled via browser plugin): Invalid response ("Math extension cannot connect to Restbase.") from server "https://wikimedia.org/api/rest_v1/":): {\displaystyle \omega(t)=\frac{d}{dt} (\omega t + \beta sin \Omega t ) = \omega + \Omega \beta cos \Omega t }
Then the reflected power can be written as
Failed to parse (SVG (MathML can be enabled via browser plugin): Invalid response ("Math extension cannot connect to Restbase.") from server "https://wikimedia.org/api/rest_v1/":): {\displaystyle P_{ref}( \omega + \Omega \beta cos \Omega t ) \approx P_{ref} (\omega) + \frac{ d P_{ref}}{d \omega} \Omega \beta cos \Omega t \approx P_{ref}(\omega) + P_0 \frac{d|F(\omega)|^2}{d\omega}\Omega \beta cos \Omega t } ,
and in this regime, the expression of Failed to parse (SVG (MathML can be enabled via browser plugin): Invalid response ("Math extension cannot connect to Restbase.") from server "https://wikimedia.org/api/rest_v1/":): {\displaystyle F(\omega) F^*(\omega+\Omega) - F^* (\omega)F(\omega-\Omega)} is purely real as shown in the following:
Failed to parse (SVG (MathML can be enabled via browser plugin): Invalid response ("Math extension cannot connect to Restbase.") from server "https://wikimedia.org/api/rest_v1/":): {\displaystyle F(\omega) F^*(\omega+\Omega) - F^* (\omega)F(\omega-\Omega) \approx 2 \mathcal{Re}[ F (\omega) \frac{ d }{d \omega} F^* (\omega)]\Omega \approx \frac{d |F|^2}{d \omega} \Omega} .
So in the reflection signal, only cosine term survives for the ac signal part. So, we should mix it with a shifted modulation signal, and we will get the error signal as (after the low pass filter)
Failed to parse (SVG (MathML can be enabled via browser plugin): Invalid response ("Math extension cannot connect to Restbase.") from server "https://wikimedia.org/api/rest_v1/":): {\displaystyle \epsilon = P_0 \frac{d |F|^2}{d \omega} \Omega \approx 2 \sqrt{P_c P_s} \frac{d |F|^2 }{d \omega} \Omega} .
Figure 4 shows the signal with a low frequency modulation.

Figure 4. Error signal with low frequency modulation. From left to right, the figures show the error signal for cavities of fitness equals to Failed to parse (SVG (MathML can be enabled via browser plugin): Invalid response ("Math extension cannot connect to Restbase.") from server "https://wikimedia.org/api/rest_v1/":): {\displaystyle 312.58} , Failed to parse (SVG (MathML can be enabled via browser plugin): Invalid response ("Math extension cannot connect to Restbase.") from server "https://wikimedia.org/api/rest_v1/":): {\displaystyle 29.80} , and Failed to parse (SVG (MathML can be enabled via browser plugin): Invalid response ("Math extension cannot connect to Restbase.") from server "https://wikimedia.org/api/rest_v1/":): {\displaystyle 10.88} respectively.
Modification to the Project
In this project, instead of locking the laser to a certain frequency, we will lock the cavity length to the laser frequency. By attaching a piezo actuator (PZT) to one end of mirror, we can tune cavity length. Once we align the cavity, making the resonance of it at the laser frequency, from the error signal, we are able to read out the change of the cavity length off the laser frequency, and also lock the cavity to the laser frequency by feed back the error signal to the control system, which will move the PZT to make the cavity resonance at the laser frequency.
In following sections, we introduced how we plan to achieve this goal and what have we done so far.
Experiment Diagram
We plan for a setup.... (the whole setup and explain how we applied the PDH locking)
Optical Part

Circuit Part
Here we demonstrate the electrical circuits we have used to make an electro optic modulator (EOM) tank circuit and a PDH board that integrates a phase shifter, mixer, amplifier and a PID loop to control and lock the cavity using PDH locking system, as shown in figure 6.
EOM Tank circuit
EOM tank circuit can be simplified down to an LC oscillator circuit whose resonant frequency is the required modulation frequency. The circuit consists of a piezo electric crystal (Lithium Niobate crystal) that changes the polarisation of light passing through it in response to an external electric field (phase modulation). The change in the phase or polarisation of light is due to the change in the refractive index of the crystal. This change can be interpreted as a capacitive effect, where the crystal stores energy in the form of electric field.
To implement the EOM circuit, the electrodes (conductive metal) are attached to the crystal such that it acts as a variable capacitor, which is then connected to an inductor (L1) and other capacitor (C1) forming an LC circuit as shown in figure 5. The inductor is chosen such that the resonant frequency of the circuit is the required modulation frequency and the dominating capacitance is the capacitance of the crystal.
Here, we require a modulation frequency of 20 MHz, so the resonant frequency of the LC oscillator is 20 MHz and the capacitance of the crystal is 10 pF. Then the required inductance for Failed to parse (SVG (MathML can be enabled via browser plugin): Invalid response ("Math extension cannot connect to Restbase.") from server "https://wikimedia.org/api/rest_v1/":): {\displaystyle \omega = \frac{1}{\sqrt{LC}}} is 6.3 Failed to parse (SVG (MathML can be enabled via browser plugin): Invalid response ("Math extension cannot connect to Restbase.") from server "https://wikimedia.org/api/rest_v1/":): {\displaystyle \mu \text{H}} .
The capacitor C1 in the circuit in figure 5 is for obtaining maximum impedance. When the circuit is at resonant frequency and maximum impedance, it leads to highest voltage across the crystal resulting in efficient modulation of light. Also the modulated signal will be transmitted through the crystal with minimum loss. The resonant frequency of the circuit can be inspected using a vector network analyzer (VNA). If there is an impedance mismatch, most of the signal will be reflected back. The inductor L1 can be tuned to obtain the resonant frequency and the capacitor C1 can be varied to obtain maximum impedance for obtaining efficient modulation.

Figure 5. EOM tank circuit.
Feedback and Locking Circuit
The circuit board given in figure 6 performs phase shifting, mixing signals, filtering and standard PID control loop for the PDH locking we aim to implement. The input signals to the circuit are: LO input (20 MHz sine signal from function generator), signal input (output from photodetector which is the transmission from the cavity) and the output signals are: control out connecting to the piezo, and the error signal.
To briefly understand the working of the circuit, it can be broken down to parts as explained below:
- Phase shifter:
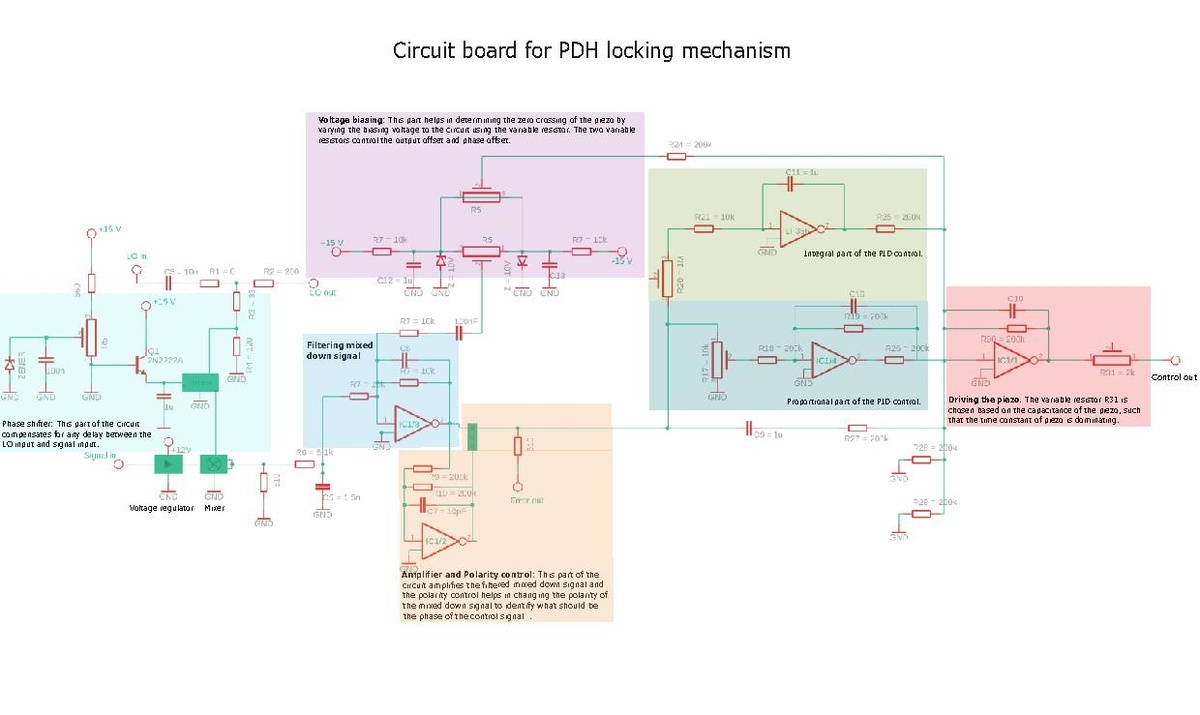
Figure 6. Feedback and Locking circuit.
Setup the experiment
EOM


Feedback and locking circuit

Cavity

test setup


Measurements


Data taking
Data Analysis
Discussion and Conclusion
Reference
- Black, E. D. (2001). An introduction to Pound–Drever–Hall laser frequency stabilization. American journal of physics, 69(1), 79-87.