Gas sensor
Introduction
The semiconductor gas sensor for carbon monoxide/combustible gas detection uses a gas-sensitive material, tin dioxide (SnO2), which has a low conductivity in clean air. The high and low-temperature cycle detection method is used to detect carbon monoxide at low temperature (1.5V heating), where the conductivity of the sensor increases with the concentration of carbon monoxide gas in the air, and to detect the combustible gases methane and propane at high temperature (5.0V heating), and to clean up the stray gases that are adsorbed at low temperature. A simple circuit is used to convert the change in conductivity to an output signal corresponding to the concentration of the gas.
Team Members
Fu Xinming, Ge Yexiao, Yang Haoqing
Setup
The diagram above shows the basic test circuit for the sensor. The sensor requires two voltages to be applied: the heater voltage (VH) and the test voltage (VC). VH is used to provide the sensor with a specific operating temperature and VC is used to determine the voltage (VRL) across the load resistor (RL) connected in series with the sensor. VC is used to determine the voltage (VRL) across the load resistor (RL) in series with the sensor. The sensor has a slight VC requires a DC power supply. VC and VH can be used as long as the electrical requirements of the sensor are met. VC and VH can share the same power supply circuit if the electrical requirements of the sensor are met. To take advantage of the sensor's performance of the sensor, it is necessary to select the appropriate RL value.
Equipment
Gas Sensitive Components
One-chip computer/microcontroller
ADC conversion module
Datasheets
Gas Sensor ENS160_Datasheet
Temperature Sensor Temperature sensor
Timeline and Milestone
| Week 8 (3/4 — 3/8) | Debug sensor module hardware devices and software code | |
| Week 9 — Week 10(3/11 — 3/22) | Measurements using gas sensors to obtain a database | |
| Week 11 — Week 12(3/25 — 4/5) | Fit curve to obtain the corresponding relationship between the output value and the gas concentration | |
| Week 13 (4/8 — 4/12) | Analyze experimental results and complete reports |
Expected Results
We hope to obtain a curve between the output value and the corresponding gas concentration, so as to know the pollution situation in the environment relatively accurately.
Report
Introduction
Band Theory
Band theory [1] explains that within a crystal lattice, there exists a valence band and a conduction band separated by an energy gap, which is closely related to the Fermi level. The Fermi level is defined as the highest energy level occupied by electrons at absolute zero temperature. Based on the size of the energy gap between these bands, materials are classified into three main categories:
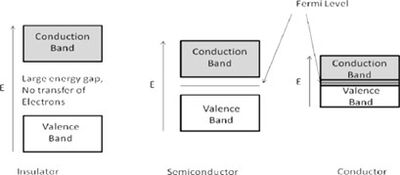
Insulators: These materials have a substantial gap between the valence and conduction bands, typically around 10 eV or more. Due to this large gap, a significant amount of energy is needed to move an electron into the conduction band, resulting in negligible electronic conduction. At zero temperature, the Fermi level represents the highest filled state.
Semiconductors: These materials feature an energy gap ranging from about 0.5 to 5.0 eV. Below the Fermi level, electrons do not have enough energy to bridge this gap, preventing conduction. However, once the energy exceeds the Fermi level, electrons can transition to the conduction band, leading to increased electrical conductivity.
Conductors: In conductors, the Fermi level is positioned within the conduction band itself, allowing for continuous electron flow and high conductivity.
Band Theory in Gas Sensors
Band theory has played a crucial role in understanding the functionality of gas sensors for several years. In this context, the interaction between a target gas and a metal oxide film's surface—typically involving surface adsorbed oxygen ions—causes a shift in the material's charge carrier concentration. This shift subsequently affects the material's conductivity or resistivity.
For n-type materials, oxidizing gases increase the resistance of the thin film, while reducing gases decrease it. The opposite is true for p-type materials. This interaction, involving oxidation-reduction (REDOX) reactions, alongside the transduction function, defines the chemiresistive behavior of these sensors. Metal oxide sensors are commonly configured as sintered pellets or as thick and thin films. The specific geometry of the crystallites and their interconnections significantly influence these receptor and transduction functions, highlighting the impact of nanotechnology in enhancing sensor performance by manipulating materials at the atomic and molecular scale.
On the other hand, p-type semiconductors, where positive holes are the majority charge carriers, exhibit increased conductivity in the presence of an oxidizing gas, which augments the number of positive holes. Conversely, the presence of a reducing gas increases the material's resistance by introducing negative charge that diminishes the concentration of positive charge carriers (holes). The various responses of these materials to different gases are summarized in Table 1.
| Classification | Oxidising Gases | Reducing Gases |
|---|---|---|
| n-type | Resistance increase | Resistance decrease |
| p-type | Resistance decrease | Resistance increase |
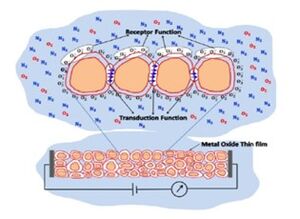
The chemiresistance [2] of metal oxides is also linked to the width of the space charge region that forms on the crystallites due to electron transfer during the adsorption and desorption of gas molecules. This space charge region creates a potential barrier that affects conduction between the grains, leading to changes in the Fermi level. In n-type materials, the interaction with oxidizing gases causes the energy bands to bend upward as electrons are depleted, whereas with reducing gases, the bands bend downward due to electron accumulation. Thus, the space charge region and band bending are closely related to the carrier concentrations within the grain, which are influenced by the grain's size and shape.
Why carbon dioxide?
As of March 2024, carbon dioxide concentrations [3] in the Earth's atmosphere were recorded at 425 ppm. Carbon dioxide is utilized in a variety of ways including in carbonated beverages, pneumatic systems, fire extinguishers, and as a critical component for photosynthesis. Additionally, it is used in lasers and refrigeration systems, both naturally and in human applications.
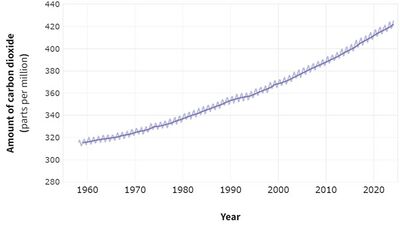
Carbon dioxide also acts as a greenhouse gas, absorbing infrared energy from the atmosphere. This absorption causes the gas to vibrate, subsequently transferring heat to the surrounding air and raising the ambient temperature. Increased levels of carbon dioxide can lead to higher temperatures. Therefore, accurate and reliable sensors that can operate within appropriate temperature ranges are crucial for monitoring changes in atmospheric carbon dioxide concentrations. The recent rise in carbon dioxide levels, primarily due to human activities such as the combustion of hydrocarbons and other carbon-containing fuels like coal, methane, petrol, and kerosene, has heightened concerns about its contribution to global warming. Such activities, when combined with oxygen, produce carbon dioxide and water. Monitoring the emissions of CO2 during these combustion processes is vital as it provides essential real-time data on the quantity of carbon dioxide being emitted.
| CO2 Concentration and Exposure time | Effect on Health (symptoms) |
|---|---|
| 0.035% | Approximate atmospheric concentration, no noticeable effect. |
| 3.3–5.4% for 15 mins | Increased depth of breathing |
| 7.5% for 15 mins | Feeling of an inability to breathe, increased pulse rate, headache, dizziness, sweating, restlessness, disorientation, and visual distortion. |
| 3%, for over 15 hours | Decreased night vision, colour sensitivity |
| 10%, 1.5 mins | Eye flickering, increased muscle activity, twitching |
| 10+% | Difficulty in breathing, impaired hearing, nausea, vomiting, a strangling sensation, sweating, after 15 minutes a loss of consciousness. |
| 30% | Unconsciousness, convulsions. Several deaths attributed to CO2 at concentrations of more than 20% |
Since 1958, atmospheric carbon dioxide levels have consistently increased and are expected to continue rising as long as there is a demand for fossil fuel combustion. High concentrations of carbon dioxide can have significant adverse health effects, including drowsiness and, at very high levels, suffocation.
The National Environmental Agency (NEA) recommends indoor CO2 levels that should ideally not exceed 800 ppm. Thus, the ability to measure and control carbon dioxide levels is crucial for maintaining indoor air quality and protecting human health.
Experimental Procedure
Temperature Sensor test
Background
For the success of this experiment, it is crucial to verify the precision of the TVOC and CO2 gas sensors across different conditions of temperature and humidity. Sensor performance attributes, including their range, sensitivity, and accuracy, may be heavily influenced by the surrounding climate. Therefore, integrating a temperature sensor to measure concurrently is vital. This addition permits continuous tracking of the ambient temperature, facilitating the adjustment of the gas sensors' outputs, leading to enhanced data reliability.
Principle of the Temperature Sensor
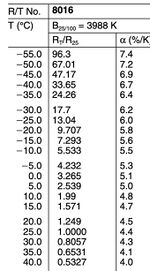
Our temperature sensing was facilitated by an NTC thermistor, model B57861S0103F040. The NTC thermistor exhibits a decrease in resistance as the temperature rises—a result of its semiconductor material’s behavior, which allows more charge carriers to engage in conduction with increasing temperature, thus lowering the resistance. The thermistor's temperature sensitivity is quantified by its B value, a parameter that delineates how its resistance varies with temperature, typically benchmarked between 25°C and 100°C. This sensor, with a B value of 3988K and a standard resistance of 10kΩ at room temperature, offers precision within a defined temperature interval, crucial for our experimental requirements.
Test Process
Before commencing the experiments and with guidance from our professor, we meticulously affixed the NTC thermistor to a cable through soldering. Care was taken to regulate the temperature and duration of the soldering process to avoid potential damage from excessive heat. Following this, we verified the thermistor's resistance using a multimeter. To interpret these resistance measurements into corresponding temperatures, we referred to the resistance-temperature (R/T) characteristic curve provided in the thermistor's datasheet.
Experimental Verification
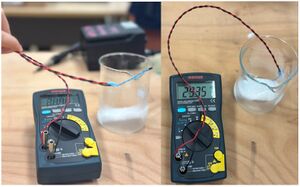
The experimental setup, as depicted in our schematic, involved testing the temperature sensor within a beaker of dry ice. The dry ice, which sublimates, acts as a heat sink, thereby lowering the beaker's internal temperature. This process creates a variable environment, ideal for assessing the sensor's response time and precision. Initial readings recorded a notable decrease in the surrounding temperature by about 5°C, affirming the sensor's sensitivity to and accurate detection of changes in lower temperature ranges.
Gas Sensor Calibration
Having confirmed the temperature sensor's functionality and dependability, we moved on to calibrate the gas sensors, another critical element of our study. The focus of this stage was to establish seamless integration and data exchange between the gas sensors and a microcontroller. Achieving this would lay a solid hardware groundwork essential for the precise quantification of CO2 levels.
Hardware Connections

In accordance with the design schematics, we carefully established connections between the gas sensors and an Arduino microcontroller. This process involved accurately wiring the sensor's data output pins to the corresponding input ports on the microcontroller, as well as providing appropriate power and ground links. The precision of these connections is fundamental to the experiment's success, so we meticulously reviewed each connection point to confirm their correctness.
Software Configuration
After finalizing the hardware setup, we connected the Arduino microcontroller to a computer using a USB interface. We then initiated the Arduino IDE software on the computer and loaded a specialized script designed to measure CO2 concentrations. This software environment enabled us to upload the necessary code to the microcontroller and facilitated real-time monitoring of both the program's performance and the data output from the sensors.

Communication Parameter Adjustment
Upon first executing the test code, we identified a need to tweak the communication addresses to guarantee stable and reliable data transfer between the microcontroller and the gas sensors. After making these adjustments, we conducted a practical test by approaching the sensor and exhaling near it to observe its responsiveness to changes in CO2 concentration. This exercise allowed us to assess both the reaction speed and the accuracy of the sensor in response to environmental changes.
System Testing and Setup
After verifying that the hardware connections were secure and the software could accurately manage the sensor, we carried out a series of functional tests to evaluate the performance of the sensors. One such test involved holding the sensor at various distances and exhaling towards it to simulate changes in CO2 levels from far to near. The outcomes confirmed that both the hardware and software were operating effectively, and that the sensors’ sensitivity and response characteristics aligned with our experimental requirements. Following these validations, we proceeded to assemble the final experimental setup, gearing up to commence the data collection phase.
Data Collection
Experimental Purpose
The objective of this experiment is to evaluate the performance of gas sensors across varying CO2 concentration environments. By meticulously controlling the experimental conditions, we aim to pinpoint the direct influence of CO2 concentrations on the sensors' output. Additionally, we will assess how temperature fluctuations affect the rate of CO2 gasification. This precise examination will help ensure the sensors' effectiveness and accuracy under different environmental scenarios.
Experimental Materials and Setup
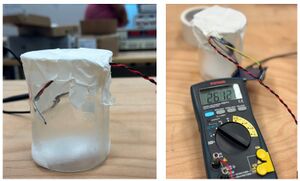
For this experiment, the required materials include dry ice, a beaker, tape, a temperature sensor, a cable, a multimeter, and gas sensors. Initially, we filled the beaker with dry ice and securely sealed its opening with tape to maintain a controlled CO2 environment within. Both the temperature and gas sensors were then positioned inside the beaker. This setup allowed us to simultaneously monitor changes in both temperature and CO2 concentrations effectively.
Preliminary Observations and Adjustments
During the initial phase of the experiment, the gas sensor detected CO2 concentrations that hovered around its lower detection limit, with minor fluctuations observed. Concurrently, data from the temperature sensor showed that the temperature inside the beaker was relatively low. These observations led us to conclude that the sublimation rate of dry ice—and consequently the rate at which it converts into CO2 gas—was significantly affected by the temperature conditions. To expedite the transformation of dry ice into gaseous CO2, it became necessary to increase the temperature within the beaker.
Optimization of Experimental Process
To improve the CO2 output and assess the gas sensor's ability to perform under various concentrations, we applied heat to the beaker. As the temperature rose, the dry ice sublimation process quickened, leading to a substantial increase in the CO2 concentration within the beaker. Consequently, the gas sensor started registering higher CO2 levels, demonstrating a broader range and greater variability in the data collected. This change allowed us to more effectively evaluate the sensor's responsiveness and accuracy at different concentrations.
Data Measurement and Collection
After initiating the heating process, we diligently continued to collect data from both the gas and temperature sensors to closely monitor the effects of elevated temperatures on CO2 concentration and sensor performance. This comprehensive dataset encompassed real-time temperature fluctuations, changes in CO2 levels, and the response times of the sensors. We plan to use this data to conduct a thorough analysis of the gas sensors' sensitivity and accuracy across different environmental conditions, providing valuable insights into their operational efficacy.
The preliminary results suggest that the gas sensors demonstrate robust responsiveness to changes in CO2 concentrations, affirming their potential utility in environmental monitoring and control systems. Continued data analysis will be crucial to gaining a deeper understanding of the sensors' behavior and stability under extreme conditions. This further investigation will help ensure the reliability of these sensors in diverse applications.
Results
To confirm the performance of the sensor under typical room temperature conditions, it is crucial first to evaluate the presence of harmful organic gases such as formaldehyde, benzene, and other toxic volatile organic compounds (TVOCs). Assessing these gas concentrations provides a preliminary insight into the indoor air quality.
Following this, converting the concentrations of these organic gases into equivalent carbon dioxide levels is an essential step. This equivalent carbon dioxide level is commonly utilized to evaluate indoor air ventilation, as it is often a reliable indicator of overall air quality. This conversion employs specific models or formulas that estimate equivalent carbon dioxide levels based on the detected concentrations of organic gases.
Given the experimental constraints—specifically, the risks associated with indoor release of TVOCs—we found that adjusting the carbon dioxide concentration in the air was a safer and more practical approach for testing the functionality and sensitivity of the ENS160 gas sensor. The ENS160 evaluates air quality by detecting chemical concentrations, making the controlled variation of carbon dioxide levels a direct method to assess the sensor's responsiveness and accuracy.
Measurement of atmospheric carbon dioxide concentration at room temperature
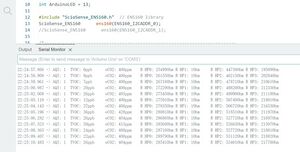
Before changing the CO2 concentration, CO2 levels were first measured under conventional room air conditions to obtain baseline data.
By measuring the baseline CO2 content, we know that the air in the lab contains 400-420 ppm of CO2. Typically, the atmospheric carbon dioxide content is 0.04%, or 400 ppm, but because the lab environment is relatively airtight and there are people breathing in the lab, the value is slightly higher than 400 ppm.
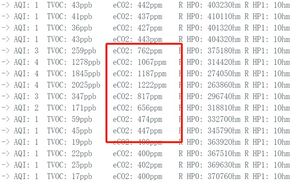
After verifying the baseline of CO2, we want to know how this gas sensor works in real life applications, starting with the value of human exhaled CO2 in the atmosphere.
From the data, we can see that in a closed environment, carbon dioxide from exhaling can increase the carbon dioxide concentration of the air around the sensor by a factor of 2 to 1,222 ppm, which is 0.12% carbon dioxide in the air. We know that human exhaled gas is 80% nitrogen, 13% to 16% oxygen and 4% carbon dioxide. The reason for the 33-fold difference from the measured value is analyzed for the following two reasons:
- The exhaled air is diluted in the atmosphere, even when exhaling into the sensor, because the amount of exhaled air is much smaller than the volume of indoor air, so the effect is minimal.
- Because the measurement process of CO2 from tvoc through the algorithm to convert the equivalent carbon dioxide content, but the human exhaled gas, almost no toxic organic volatiles, containing carbon elements are part of the CO2, may be ens160 gas sensors are not sensitive to inorganic substances containing carbon elements, this part of the test we will verify through the next.
Measurement of the concentration of carbon dioxide during the sublimation of dry ice
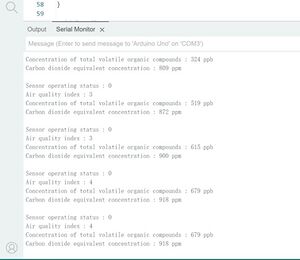
In order to measure the continuous increase of carbon dioxide content how to act on the ens160 gas sensor to measure the carbon dioxide concentration, we use the melting of dry ice to release to continue to produce carbon dioxide, where a beaker with dry ice, the gas sensor and temperature sensor into the beaker and sealed with tape, the following are the results of the measurements and analysis
After setting the input temperature of the gas sensor according to the thermistor, the CO2 release was slow at first because of the low temperature, resulting in actually only doubling the CO2 content compared to the baseline of the CO2 content in the air, i.e., the beaker contained only about 0.08% CO2.
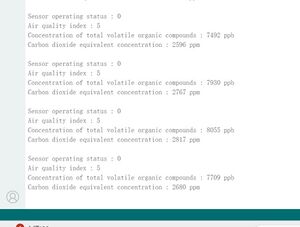
We tried to speed up the process of carbon dioxide release by heating, because there is no suitable heat source to heat the beaker in the lab, we chose to cover the beaker wall with our hand to make the air temperature in the beaker rise, and the carbon dioxide content of the beaker is as follows when the air temperature in the beaker is around -5℃
Compared to the previous unheated state (-25°C), the concentration of carbon dioxide in the beaker increased by a factor of 2. Compared to the atmospheric concentration of carbon dioxide, which is a factor of 7, the rate of evaporation of dry ice to carbon dioxide after heating is significantly better than the rate of evaporation from a sealed beaker containing dry ice placed at 25°C room temperature.
The rate of evaporation of dry ice varies significantly under different environmental conditions. For example, in a well-controlled environment, the temperature of dry ice can be reduced to -98°C, which is lower than the -78.5°C routinely reported, indicating that the actual temperature of dry ice in an unsaturated environment may be lower than the standard sublimation temperature. [4]
For this measurement we analyzed as follows: because the measurement process of CO2 is the equivalent carbon dioxide content converted from tvoc by an algorithm, but the gas exhaled by a person is almost free of toxic organic volatiles, and the portion that contains carbon is all CO2, and it is possible that the ens160 gas sensors are not sensitive to inorganic substances containing carbon, and they need to be calibration.
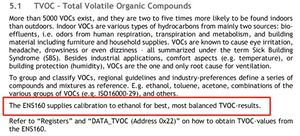
The technical documentation also mentions the need to use ethanol to calibrate the carbon dioxide measurement, which was ignored during our experiments when the sensor performance was intact by default. If the carbon dioxide produced by human exhalation is used for estimation and calibration, it is relatively reasonable to find that about 10% of the carbon dioxide is stored in the beaker.
Results Discussion
- The algorithm for the conversion of tvoc to CO2 is unknown and is influenced by a number of factors, such as temperature, humidity and the state of the gas present. In the technical documentation and an extensive review of the literature, there is no mention of an algorithm for this conversion process, and since the composition of the metal oxides is unknown, it is difficult to analyze what factors dominate the conversion in terms of material properties.
- the beaker is not sealed enough, and in the middle of the experiment, we opened the tape many times to adjust the position of the sensor, there is CO2 leakage, and because the carbon dioxide is affected by the temperature of the release rate is slow, and does not fill up the container very quickly, in the safety factor (for fear of the beaker blowing up and do not dare to forget to add water inside to accelerate the sublimation), carbon dioxide sublimation has been relatively slow.
- dry ice sublimation heat absorption, lower temperature inside the beaker, this sensor is a resistive sensor, the temperature decreases to affect the sensitivity of the sensor and other characteristics. And this sensor is used in daily life for the measurement of harmful gases in the home environment, for carbon dioxide range up to only 162.5 times the air concentration, that is, 6.5%, this value in the high concentration of CO2 environment is actually small. Therefore, compared to the high density of CO2 in the small space inside the beaker, the sensitivity or other characteristics of the sensor have relevant limitations and cannot be measured accurately.
Conclusions and outlook
The Ens160 sensor is indeed sensitive to the measured target gas and responds quickly, confirming the suitability of gas sensors for air quality monitoring in everyday household environments.
However, due to the limitations of the measurement environment, we would have preferred to explore the material properties of this sensor to obtain the tvoc to carbon dioxide conversion process and characteristics.
References
- ↑ Fine GF, Cavanagh LM, Afonja A, Binions R. Metal Oxide Semi-Conductor Gas Sensors in Environmental Monitoring. Sensors. 2010; 10(6):5469-5502. https://doi.org/10.3390/s100605469
- ↑ Shankar, Prabakaran & Rayappan, John Bosco Balaguru. (2015). Gas sensing mechanism of metal oxides: The role of ambient atmosphere, type of semiconductor and gases -A review. Science Letters. 4. 126.
- ↑ Rebecca Lindsay Climate Change: Atmospheric Carbon Dioxide. Retrieved April 2024, from https://www.climate.gov/news-features/understanding-climate/climate-change-atmospheric-carbon-dioxide
- ↑ Murphy M J, McSweeney T I. Technical assessment of dry ice limits on aircraft[M]. Transportation Research Board, 2013.