Impedance Spectroscopy for Detecting Phase Transitions in KBr
Team members
Laphas Precmcharoen, Song RunLin, Gao Jia
Abstract
This study presents an investigation into the phase transition of potassium bromide (KBr), a semiconductor material, using impedance spectroscopy across a temperature range of 50°C to 250°C. The purpose of this research is to explore the capability of impedance spectroscopy as an effective sensor for detecting phase transitions in semiconductors. By conducting measurements of KBr's impedance properties and analyzing Nyquist plots through RC parallel circuit fitting, the study identifies significant changes in conductivity, indicative of a phase transition. The findings include a distinct phase transition in KBr around 190°C, highlighted by shifts in the conductivity times temperature (σT) against reciprocal temperature (1/T) and the logarithm of conductivity (log(σ)) against reciprocal temperature (1/T) plots. These shifts suggest a structural alteration in the KBr crystal lattice, aligning with phase transition behaviors observed in other semiconductor materials. The research underscores the sensitivity and reliability of impedance spectroscopy as a sensor for phase transition detection, contributing valuable insights into the electrical and structural properties of semiconductors. This study not only advances the understanding of KBr but also demonstrates the broader applicability of impedance spectroscopy in material science and semiconductor research, paving the way for future investigations into phase transitions of various materials.
Introduction
Phase transitions in materials, especially semiconductors, are interesting in the field of material science due to their profound impact on the electrical, thermal, and mechanical properties of materials. Understanding these transitions is crucial for the development of advanced materials and devices that can operate across varying environmental conditions. Potassium bromide (KBr) is one such semiconductor material whose phase transition properties can be detected, particularly using modern sensing techniques like impedance spectroscopy. Impedance spectroscopy offers a non-destructive method to probe the electrical properties of materials as a function of frequency, making it a potential tool for sensing and characterizing phase transitions.
The application of impedance spectroscopy as a sensor for detecting phase transitions is based on its ability to measure changes in the material's impedance or electrical resistance, which can indicate changes in the material's structure or composition. This study aims to investigate the phase transition of KBr across a temperature range of 50°C to 250°C, utilizing impedance spectroscopy to monitor changes in conductivity and capacitance that signify a phase change. By analyzing these changes, the study seeks to demonstrate the efficacy of impedance spectroscopy as a sensitive and reliable sensor for detecting phase transitions in semiconductor materials.
This report outlines the methodology employed in preparing KBr pellets, the impedance spectroscopy measurement process, and the analysis of the resulting data. Through a detailed examination of Nyquist plots and the application of parallel RC circuit fitting, the study identifies a distinct phase transition in KBr, marked by significant changes in its electrical properties. The results highlights the potential of impedance spectroscopy as a versatile and powerful tool for sensing phase transitions, offering new ways for exploration in material science and semiconductor research.
Theory
The theory underlying the experimental study of potassium bromide (KBr) through impedance spectroscopy is based on the principles of solid-state ionics and phase transition physics. Impedance spectroscopy, a powerful technique for characterizing the electrical properties of materials, relies on the measurement of a material's response to an applied alternating current (AC) signal over a range of frequencies. This response provides insights into both the conductive and dielectric properties of the material.
Arrhenius Equation
One of the law used in the analysis is the Arrhenius equation, which describes the temperature dependence of reaction rates, and by extension, the conductivity of ionic conductors. The equation is given by:
where is the conductivity at temperature , is a pre-exponential factor, is the activation energy for conductivity, is the Boltzmann constant, and is the absolute temperature. The equation decribes the exponential relationship between conductivity and temperature, indicating how the mobility of charge carriers (ions in the case of KBr) increases with temperature.
Nyquist Plots
Nyquist plots are a graphical representation used in impedance spectroscopy to visualize a material's impedance across a range of frequencies. These plots display the imaginary part of the impedance versus its real part , often resulting in a semi-circular arc whose characteristics provide insights into the material's electrical properties. For ionic compounds, the diameter of the semi-circular arc in a Nyquist plot changes with temperature, reflecting alterations in the material's impedance. This variation is crucial for identifying changes in the material's structure and properties, such as those occurring during a phase transition. The shape and size of the arc can be analyzed to deduce the resistance and capacitance of the material, which are directly related to its conductivity and dielectric properties.
RC Circuit Fitting
RC circuit fitting is a process used to understand the electrical properties of a system by fitting its impedance data to a model made up of resistors (R) and capacitors (C). The RC circuit can be configured in various ways, but the two most common configurations are the series RC circuit and the parallel RC circuit. Each configuration has its own distinctive equation for impedance, reflecting how the components interact with each other and with an alternating current (AC) signal.
Series RC Circuit
In a series RC circuit, the resistor and capacitor are connected in series with the AC voltage source. The total impedance of a series RC circuit is calculated by combining the resistance and the reactance of the capacitor:
where is the complex impedance, is the resistance, is the imaginary unit, and is the capacitive reactance. The angular frequency, , is , where is the frequency of the AC signal, and is the capacitance.
The magnitude of the impedance in a series RC circuit is:
And the phase angle between the voltage and the current is:
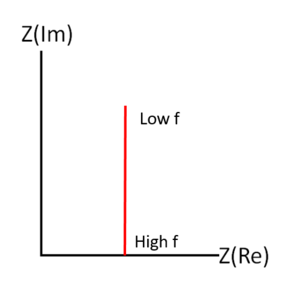
For a series RC circuit, the real part of the impedance is , and the imaginary part is . Plotting this on the Nyquist plot, we get a vertical line that starts at at low frequency and approaches as frequency increases.
Parallel RC Circuit
In a parallel RC circuit, the resistor and capacitor are connected in parallel to the AC voltage source.
The admittance (Y) is the reciprocal of the impedance (Z) and is given by:
where is the conductance (the reciprocal of resistance, ), and is the susceptance (the reciprocal of reactance, ) of the capacitor.
The total impedance in a parallel RC circuit is then:
To find the magnitude and phase of ( Z ), it's often easier to work with conductance and susceptance:
The magnitude of the impedance is:
And the phase angle is:
For a parallel RC circuit, multiplying the numerator and denominator by the complex conjugate of the denominator, we get . Therefore, the real part of the impedance is , and the imaginary part is . On the Nyquist plot, this configuration produces a semicircle, starting from at low frequency and approaches the origin as frequency increases.
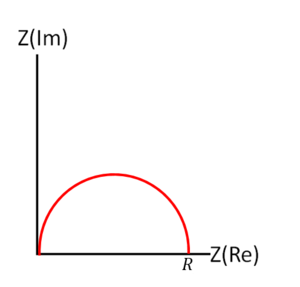
These equations are fundamental for RC circuit fitting, allowing one to extract values of resistance and capacitance that best match the observed impedance data from a material or an electronic component. The fitting process involves adjusting the theoretical values of R and C in the model until the calculated impedance matches the experimental impedance data across a range of frequencies. This technique is widely used in materials science, electrochemistry, and electronic engineering to characterize the electrical properties and behavior of materials and circuits.
Materials
1. Impedance Spectroscopy System
2. KBr samples
3. Two-electrode system
4. Frequency generator
Procedure
Palletizing KBr
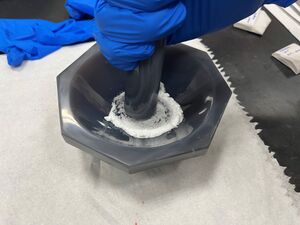
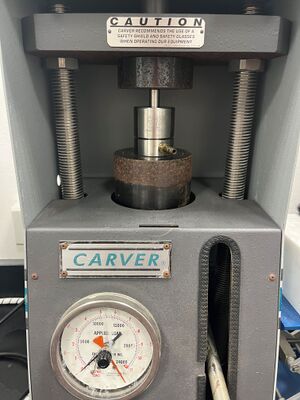
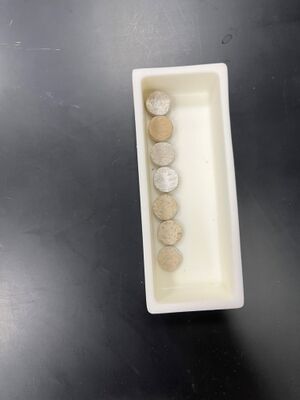
To prepare the KBr for impedance spectroscopy, the powdered KBr was first palletized. This process involved grinding the KBr into powder to achieve a powdery consistency and then compressing under a pressure of approximately 5 tons using a hydraulic press for approximately 3 minutes, forming a compact, disk-shaped pellet with a diameter of 11.4 mm and a thickness of approximately 2.61 mm. The uniform size and shape of the pellet were crucial for ensuring consistent and reliable impedance measurements.
 |
 |
Application of Silver Paint
After palletization, both sides of the KBr pellet were coated with a thin layer of silver paint. This step was performed carefully to ensure a uniform conductive layer was formed, minimizing any potential impedance contributions from uneven surface conductivity. The silver-coated pellet was then left to dry for 15 minutes, ensuring the paint was fully set and conductive.
Electrode Setup
Once the silver paint was dry, electrodes were attached to both sides of the pellet. This setup facilitated the application of an alternating current (AC) through the pellet, necessary for impedance measurements. The electrodes were connected to the impedance spectroscopy system.
Impedance Spectroscopy System and Heating
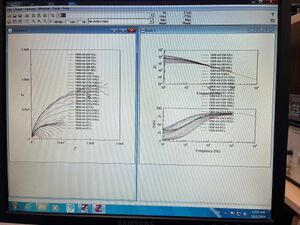
The impedance spectroscopy measurements were conducted using an impedance analyzer capable of capturing impedance data over a broad frequency range. The frequency range for the measurements spanned from 100 Hz to 100,000 Hz, with a total of 60 frequencies measured at evenly spaced logarithmic intervals. This comprehensive frequency range was selected to ensure a detailed characterization of the KBr pellet's impedance properties across different electrical conduction regimes. For the experiment, the KBr pellet, with electrodes attached, was placed in a temperature-controlled chamber within the impedance spectroscopy system. The temperature of the chamber was increased in steps of approximately 10°C, starting from 50°C and reaching up to 250°C. At each temperature step, impedance data were recorded across the predetermined frequency range. This methodical temperature increment allowed for the detailed observation of the KBr pellet's phase transition behavior at each step.
Data Analysis
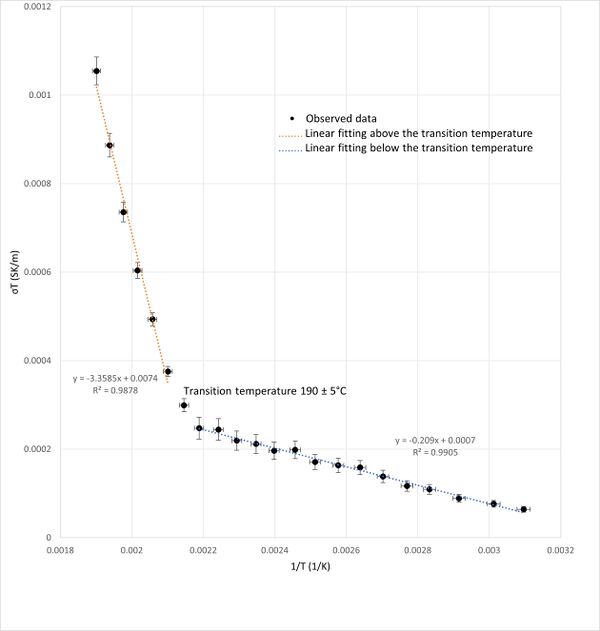
Impedance data were analyzed and presented as Nyquist plots for each temperature step. The data was fitted using parallel RC circuit. The fitting techniques were employed on these plots to deduce the resistance and capacitance values across the temperature spectrum. From the resistance values, the conductivity was computed using pallet's dimension. The conductivity versus tmeperature data was plotted in the following 2 ways: 1. the conductivity times temperature (σT) versus reciprocal temperature (1/T) graph, 2. the log(σ) versus reciprocal (1/T) temperature graph. These analyses aimed to identify shifts in the slopes of these graphs, which are indicative of phase transitions within the KBr pellet. Special emphasis was placed on changes observed around 190°C, where a noticeable shift in the slopes suggested a phase transition.
The choice to analyze the relationship between (σT) and (1/T) is inspired by the seminal work of Suresh Chandra and John Rolfe, as detailed in their paper "Ionic Conductivity of Potassium Bromide Crystals." Their research demonstrated a clear linear relationship between these variables, highlighting the utility of this approach in predicting conductivity across different temperatures and identifying phase transitions.
In addition to the (σT) versus (1/T) analysis, our study also incorporates the log(σ) versus (1/T) graph, supported by the Arrhenius equation. The Arrhenius law provides a fundamental description of how reaction rates (or, in our case, conductivity) increase with temperature. By plotting the natural logarithm of the conductivity against the reciprocal of the temperature, we can extract the activation energy for the conduction process within the KBr crystals. This relationship is crucial for understanding the temperature dependence of ionic movement and offers additional evidence of phase transitions, especially when anomalies or deviations from the expected linear trend are observed.
Results
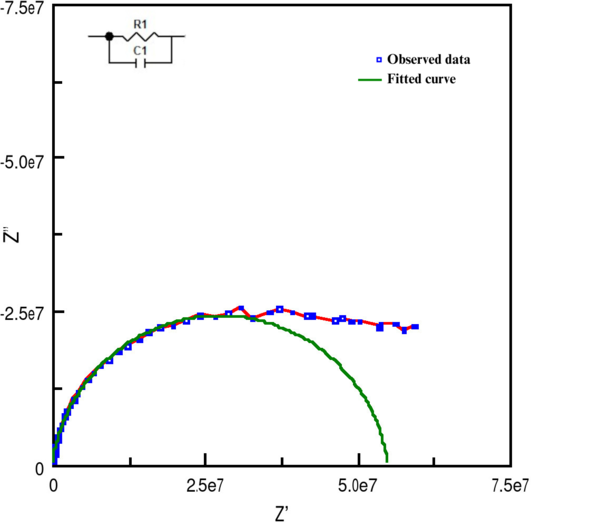
The impedance spectroscopy measurements of potassium bromide (KBr) across the temperature range of 50°C to 250°C resulted in a series of Nyquist plots. Each plot displayed a semi-circular arc, the diameter of which varied with temperature, indicating changes in the material's impedance properties. The RC parallel fitting method was employed to approximate the pellet's conductivity and capacitance values at each temperature step. The RC parallel fitting applied to a selected Nyquist plot at 153C is illustrated in Figure 1.
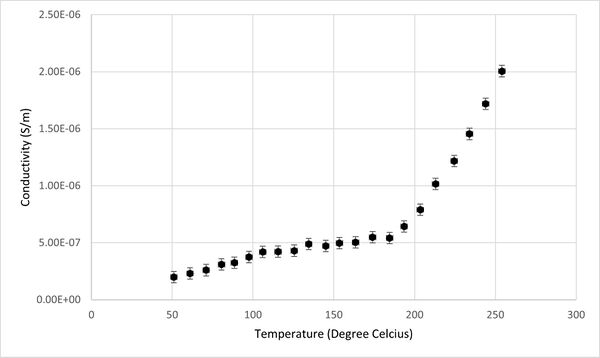
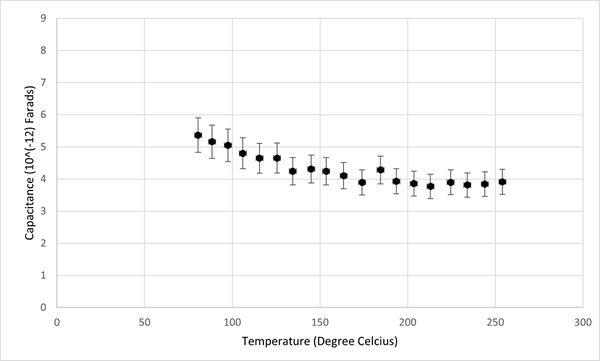
Additionally, the relationship between conductivity, capacitance, and temperature for the KBr pellet was graphically represented, as depicted in Figures 2 and 3. It was observed that the capacitance of KBr remained relatively stable across the temperature range from 50°C to 250°C. This stability suggests that capacitance is not an effective sensing property for identifying phase transitions in KBr. However, a notable variance in the conductivity of the KBr pellet within the same temperature range positions conductivity as a more viable sensor property for the detection of phase transitions. Therefore, the study will concentrate on analyzing conductivity as the primary sensor property.
A graph plotting (σT) versus (1/T) was presented in Figure 4.The graph revealed a linear relationship in two distinct segments, separated by a noticeable slope change (inflection point). Therefore, a linear fit of these two segments is used (Figure 4). This inflection point, occurred around 190°C, indicates a phase transition temperature for KBr. The linearity of the segments before and after the transition point agrees with the measurement done by Suresh Chandra and John Rolfe.
Similarly, the plot of the logarithm of conductivity (log(σ)) against reciprocal temperature (1/T) shown in figure 5 exhibited two linear regions intersecting at the same transition temperature of approximately 190°C. The two straight regions are consistant with the Arrhenius law. The change in the slope at approximately 190C indicates a shift in activation energy at for ionic conductivity. This shift in activation energy implies a structural phase transition within the KBr crystal lattice, as it indicates changes in the energy barrier of ionic movement, reflecting an alteration in the crystal's structural configuration.
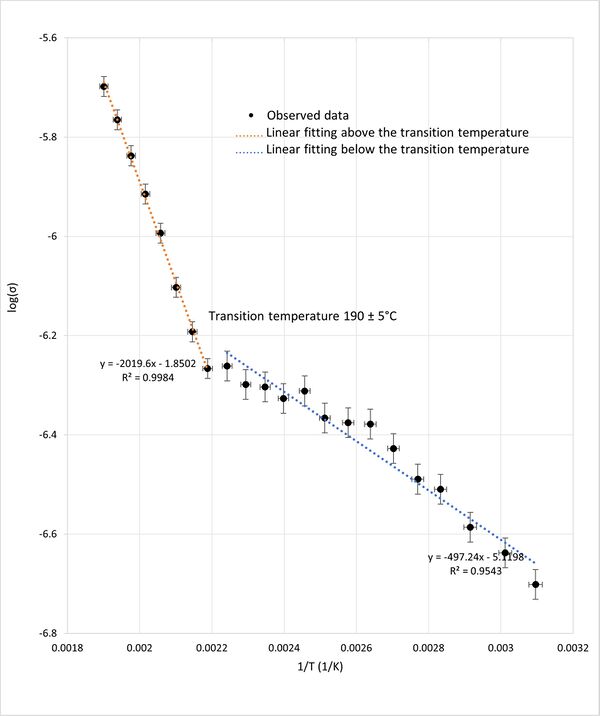
The identification of a transition temperature around 190°C, consistent across both graphical analyses, highlights the sensitivity of impedance spectroscopy in detecting phase transitions in KBr. This temperature mark serves as a critical point where the material's conductive properties undergo significant changes, likely due to alterations in the crystal structure which will be discussed in more detailed in the discussion section.
Discussion
The data suggests that semiconductor KBr undergoes a phase transition around 190°C. Before and after this temperature, the sample points approximately follow linear fitting, as evidenced by both the conductivity times temperature against reciprocal temperature and the logarithm of conductivity against reciprocal temperature graphs. Comparing this observation with previous studies on phase transitions in two other semiconductors, NaNbO3 and BaZrxTi1-xO3, we can infer that in KBr potential structural changes are occuring around 190°C, indicative of phase transition.
In the case of NaNbO3, research indicates that a phase transition occurs from pseudocubic to cubic symmetry in single crystal NaNbO3 at 640°C. Additionally, the permittivity curve shows three local maxima at 250°C, 448°C, and 574°C, corresponding to orthorhombic to tetragonal, tetragonal to pseudocubic’, and pseudocubic” to another phase transition respectively.For BaZrxTi1-xO3, the study first established different compositions (e.g., BZT1, BZT2, BZT3, etc.) and measured transitions from 20°C to 225°C. The results indicated a sharp transition at the phase transition temperature (Tm) for BZT1, with another transition at a lower temperature (Td, orthogonal to tetragonal). Other compositions exhibited only one sharp transition at Tm, with Tm decreasing gradually with increasing x.
Impedance Spectroscopy offers several distinct advantages over other techniques for detecting phase transitions in materials compared with other devices such as Raman Spectroscopy and SEM. Firstly, it provides direct measurements of a material's electrical response to an applied electric field. This encompasses crucial parameters like conductivity, capacitance, dielectric constant, and impedance, offering comprehensive insights into the material's behavior. Moreover, Impedance Spectroscopy boasts non-destructive capabilities, enabling researchers to analyze materials without altering their chemical or structural properties. This is invaluable for studying delicate or sensitive materials where preserving integrity is paramount. Additionally, Impedance Spectroscopy's broad frequency range, spanning from millihertz to gigahertz, facilitates the examination of processes occurring across various timescales. This versatility allows for a comprehensive understanding of phase transitions and related phenomena, making it a powerful tool in materials research and characterization.
To sum up, these studies elucidate structural changes during phase transition points, which could explain the observed slope changes in our graph. This further suggests that our experiment detects the phase transition in KBr by sensing conductivity as a function of temperature. Furthermore, compared with Raman Spectroscopy and SEM, our approach stands out for its direct measurement of electrical response, non-destructive nature and wide frequency range.
Conclusion
The study explored the utility of impedance spectroscopy as a sensor for detecting phase transitions in potassium bromide (KBr), spanning a temperature range from 50°C to 250°C. Through the preparation of KBr pellets and the analysis of Nyquist plots alongside parallel RC circuit fitting, we were able to identify a distinct phase transition occurring around 190°C. This transition, marked by shifts in the slope of 2 graphs: 1. the conductivity times temperature (σT) versus reciprocal temperature (1/T) and 2. the logarithm of conductivity (log(σ)) versus reciprocal temperature (1/T) graphs, suggests significant structural changes within the KBr crystal lattice. The ability of impedance spectroscopy to sense these changes effectively positions the meathod of impedance spectroscopy as a potential sensor for phase transitions.
The consistency and repeatability in both two analysis of the observed phase transition around 190°C shows the effectiveness and sensitivity of impedance spectroscopy as a method for detecting and analyzing phase transitions in semiconductor materials. Moreover, our study's findings contribute valuable data to the existing body of knowledge on KBr, providing a clearer understanding of its electrical and structural properties and how these properties evolve with temperature.
The results not only highlighting the sensitivity of impedance spectroscopy in sensing phase transitions but also highlight its potential as a versatile tool in the analysis of semiconductor materials. By capturing the changes of electrical property changes as a function of temperature or other variables such as pressure, this method provides insights into the underlying structural dynamics, paving the way for its broader application in the study of electrical and structural properties of various materials.
In conclusion, the successful detection of a phase transition in KBr utilizing impedance spectroscopy ij its capability as an effective sensor. This approach not only provides a better understanding of KBr's electrical and structural properties but also broadens the scope of impedance spectroscopy as a sensing tool for phase transitions in semiconductors. Future research could extend this methodology to investigate phase transitions in other materials, further expanding our knowledge of solid-state physics and enhancing the application of impedance spectroscopy as a sensing technology in material science.
References
[1]Hoshino H, Shimoji M. Ionic conductivity of potassium bromide and sodium bromide crystal coloured with bromine[J]. Journal of Physics and Chemistry of Solids, 1971, 32(2): 385-393.
[2]Jawad S A, Alnajjar A, Bader M. Dielectric spectroscopy of pure and KBr dispersed polypyrrole[J]. International Journal of Polymeric Materials and Polymeric Biomaterials, 1998, 39(1-2): 21-31.
[3]Choi B K. Phase transitions of crystals[J]. Journal of Physics: Condensed Matter, 1999, 11(3): 713.
[4]Brennecke C G. Conductivity Measurements on Potassium Halides[J]. Journal of Applied Physics, 1940, 11(3): 202-207.
[5]Ramola Y, Louis C N, Amalraj A. Electronic Band Structure, Density of States, Phase Transitions, Metallization and Superconducting Transition of KBr under High Pressure[J]. Orbital: The Electronic Journal of Chemistry, 2020: 69-75.
[6]Chandra S, Rolfe J. Ionic conductivity of potassium bromide crystals[J]. Canadian Journal of Physics, 1971, 49(16): 2098-2105.
[7]Nobre M A L, Lanfredi S. Phase transition in sodium lithium niobate polycrystal: an overview based on impedance spectroscopy[J]. Journal of Physics and Chemistry of Solids, 2001, 62(11): 1999-2006.
[8]Sateesh P, Omprakash J, Kumar G S, et al. Studies of phase transition and impedance behavior of Ba (Zr, Ti) O 3 ceramics[J]. Journal of Advanced Dielectrics, 2015, 5(01): 1550002.
[9]Kapoor S, Gour A, Singh S. Structural and elastic properties of KBr at high pressure and high temperature[J]. Phase transitions, 2017, 90(10): 955-963.
[10]Guo Y, Sun D, Ouyang B, et al. Probing the dynamics of the metallic-to-semiconducting structural phase transformation in MoS2 crystals[J]. Nano letters, 2015, 15(8): 5081-5088.
Appendix
The link is our raw data of KBr pallet. Raw data includes the parameter of pallet, temperature range, resistance, capacitance, conductivity and so on. Meanwhile shows the trending graphs of raw data.
Timeline
| 5/3 | Learn how to do the Impedance spectrocopy and how to palletize samples | |
| 7/3 | Palletize powdered KBr | |
| 12/3 | Patelletize KBr into different thicknesses | |
| 14/3 | Silver paint both sides of the pallets | |
| 19/3 | 1st attempt on the impedance spectroscopy across different temperatures | |
| 20/3 | final attempt on the impedance spectroscopy across different temperature from 50°C - 255°C of the pallet with diameter 11.4 mm and thickness 2.61 mm | |
| 21/3 | Do the impedance spectroscopy while applying bias DC voltage from 0V to 5V of the pallet with diameter 11.7 mm and thickness 3.54 mm and do the impedance spectroscopy on the pallets with different thicknesses | |
| 26/3 | Fit the nyquist plot of the temperature data with a semi circle to get approximated resistance and capacitance | |
| 2/4 | Discuss the result and fit the DC dependent data with semi circle | |
| 4/4 | Analyze the data and discuss | |
| 9/4 | Discuss the possible mechanism of phase transition and updating wiki page |


