LEDs as Photodiodes
Group Members
Abas Syahbana, Lu Xinghao
Introduction
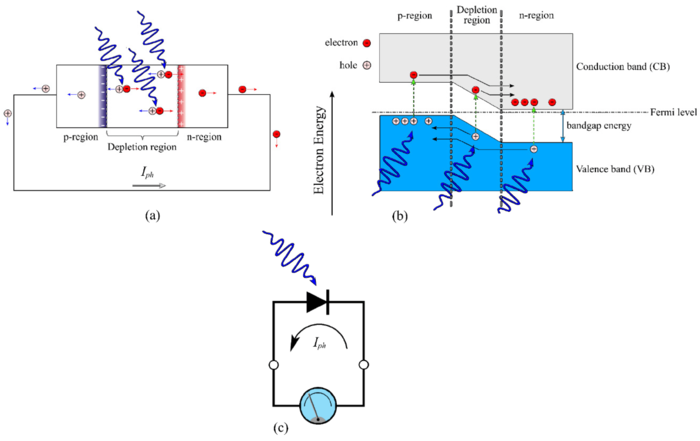
In the Light-Emitting Diode (LED), there is a region called the depletion region. Photons outside the LED can fall to this region. Photons with greater energy than the energy gap of the semiconductor that composes the LED will be absorbed and produce electron-hole pairs. Then, a current is produced caused by the electric field across the region that pulls those pairs. This resulting current, called photocurrent, is proportional to the number of photons that fall to the depletion region.
 |
Setup
Equipment
- Power Source
- Resistors (1k and 100k)
- Breadboard
- Jump wires
- Variety of LEDs
- Oscilloscope
- Probe
Experimental Setup
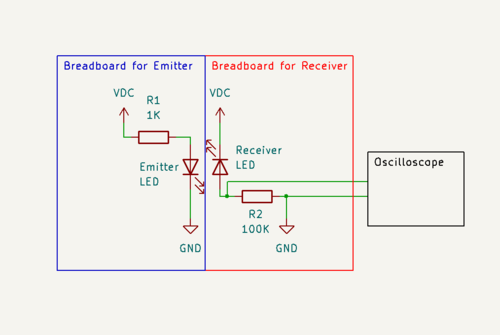
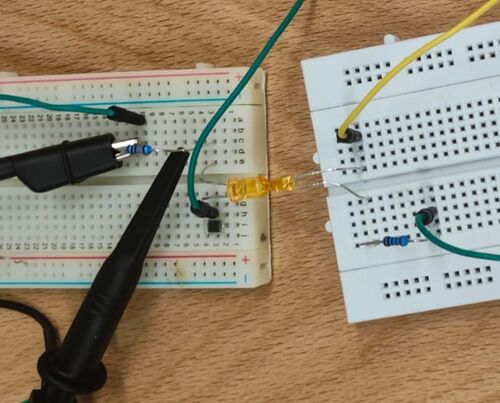
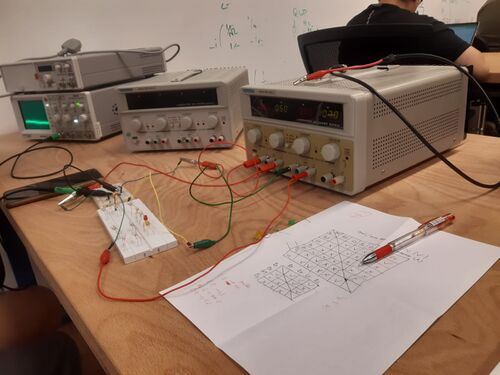
For the experiment, we have designed two circuits. One of them was emitting circuit and the other one was receiving circuit. For the emitting circuit, we used LED as the light source. By changing the voltage applied to that LED, we can control the intensity of emission. As the same time, we also measured the current through LED corresponds to the certain choice of voltage. For the receiving part, we also used LED to receive the light. However, by reversing the direction of LED, which would response to different wavelengths of light and produced the current. Then, by measuring the voltage of the resistor, which was series connected in the circuit through oscilloscope, we could detect the signals.
 |
 |
 |
Results and Discussion
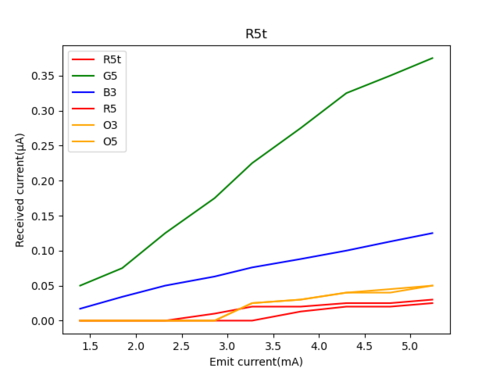
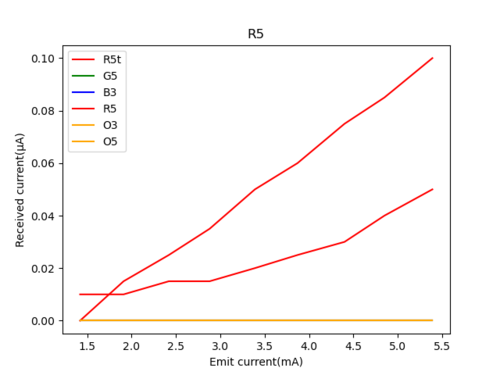
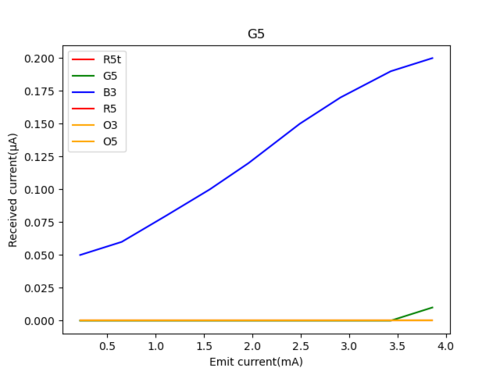
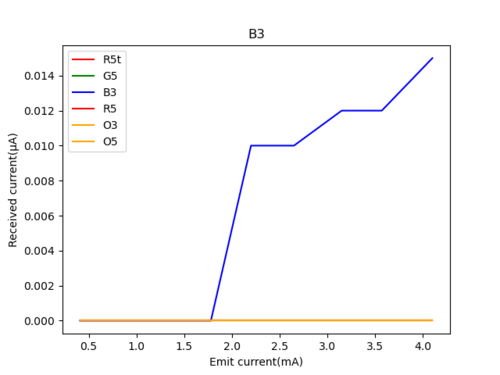
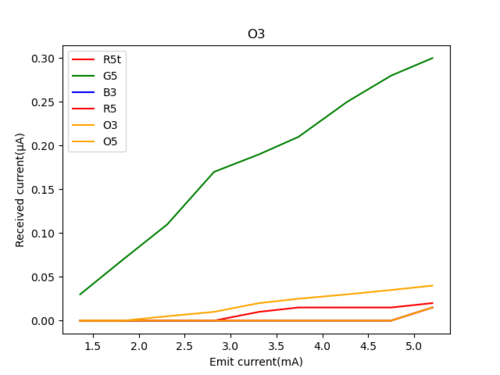
In the experiment, there are some LEDs that we used as emitter and receiver such as transparent 5 mm red LED (R5t), 5 mm green LED (G5), 3 mm blue LED (B3), 5 mm red LED (R5), 3 mm orange LED (O3), and 5 mm orange LED (O5). We varied the applied voltage on the emitter (3, 3.5, 4, 4.5, 5, 5.5, 6, 6.5, and 7 V) and measured the corresponding current on the emitter. We also set the voltage for the receiver to be 5 V and recorded the photocurrent on the receiver using an oscilloscope. By knowing the photocurrent on the receiver and measuring the current on the emitter, we can produce some graphs shown below.
 |
 |
 |
 |
 |
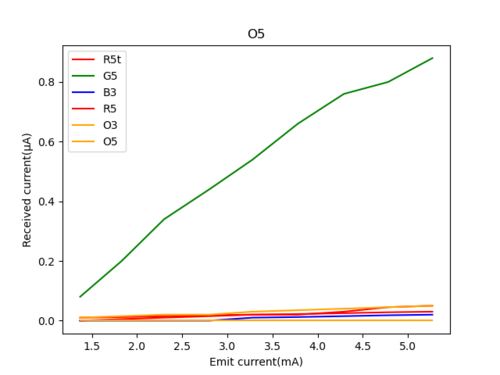 |
We controlled the other parameters and concentrated just on the color. Mostly the voltage of signal we found are only around 0.5 mV. However, we also discovered that some special LED pairs can reach the voltage about 20 mV, which is far large than the others. We thought that situation was very interesting and tried to identify the inner relation between them.
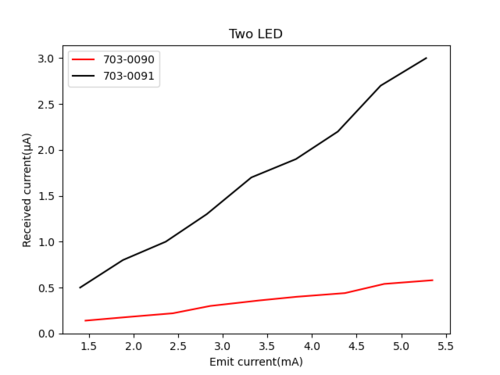
We also tried other LEDs with knowing part numbers (703-0090 and 703-0091) from the Multicom Pro. From their datasheet, the applied voltage has a somewhat linear relation with forward current. Moreover, forward current has a linear relation with relative luminous intensity of the emitter. Thus, setting the applied voltage for the emitter means somewhat setting the light intensity of the emitter as well.
We used the same type of LEDs as the emitter and the receiver. As shown below, the photocurrent produced from 703-0091 is bigger that the photocurrent produced from 703-0090. When we checked the datasheets of these LEDs, we noticed that the power dissipation of 703-0091 is 72 mW, bigger that the power dissipation of 703-0090 (66 mW). We predict that there is a relation between the photocurrent produced and the power dissipation.
 |
References
- Schirripa Spagnolo, G., Leccese, F., & Leccisi, M. (2019). LED as Transmitter and Receiver of Light: A Simple Tool to Demonstration Photoelectric Effect. Crystals, 9(10).
- 3mm Round LED Lamp [Datasheet]. U.S. Multicomp Pro. https://www.farnell.com/datasheets/2863873.pdf
- 3mm Round LED Lamp [Datasheet]. U.S. Multicomp Pro. https://www.farnell.com/datasheets/2863874.pdf
Logbook
5 March 2024: we took variety of LEDs in the workshop. We detected avalanches.
7 March 2024: We tried all of the LEDs. almost all of them can not detect avalanches.
12 March 2024: We tried other variety of LEDs from the workshop. we can not see any detection of avalanche. Then, we knew that we use LEDs in unconventional way.
14 March 2024: We didn't see any detection. We plan to use function generator to see any detection.
19 March 2024: We used function generator to see the signal. We didn't see anything.
21 March 2024: We saw something that can be a signal with frequency of the function generator f=1858 Hz. We planned to use battery to lessen the noise.
26 March 2024: We were somehow doing the experiment wrongly. It was using battery for the transmitter and trying detecting avalanche
28 March 2024: We changed the power source of the receiver to battery. We still didn't get rid of the noise.
2 April 2024: We can see the difference in signal. However we need bigger sensing resistor to measure it better.
4 April 2024: We can detect the signal. Then, we changed the function generator with a power source for the transmitter. We started measuring all of the combination of LEDs as the emitter and the receiver.
9 April 2024: We continued measuring all of the combination with 10x probe. We didn't use some LEDs that cannot detect light as receiver.
11 April 2024: We completed the measurement of the combination of 5 different LEDs as emitter and receiver.
16 April 2024: We measured the same type of LEDs as the emitter and receiver. We also measured the current at the emitter
18 April 2024: We finished measuring the same type of LEDs as the emitter and receiver and the current at the emitter.