Simple Optical Heart Rate Monitor
Here is the report of the project with some observations and discussions.
Team members
Yang Meng Ting
Idea
Photoplethysmography (PPG) is a non-invasive optical technique commonly employed in commercial wearables and pulse oximeters to monitor heart rate and blood oxygen saturation. The main goal of this project is to replicate the foundational principles of PPG using a simple, do-it-yourself (DIY) approach. By constructing our own optical heart rate monitor, we aim to gain a deeper understanding of how PPG technology functions and to explore its applications and limitations in a more accessible and educational manner. This initiative not only facilitates hands-on learning but also encourages innovation and experimentation with optical sensor technology, potentially leading to novel applications and enhancements in personal health monitoring.
Mechanism
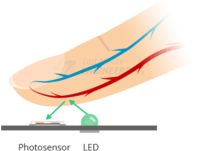
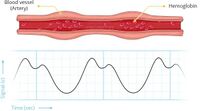
The simple optical heart rate monitor functions based on the principle of photoplethysmography (PPG). This technique utilizes a light source (an LED) and a photodetector to measure subtle changes in blood volume within tissue. The LED illuminates the fingertip or earlobe, and the photodetector measures the amount of light that passes through. As the heart beats, the volume of blood in the illuminated area changes, influencing the amount of light reaching the photodetector. These fluctuations in light intensity are analyzed by a microcontroller to calculate the heart rate in beats per minute (BPM).
 |
 |
Setup
Equipment
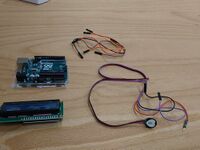
Component List:
|
 |
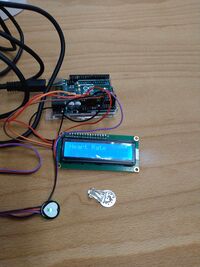
Circuit Overview
 |
 |
Software and Codes
The development and visualization of this project were supported by several key software tools and programming resources:
- Arduino IDE: This integrated development environment (IDE) was used to write and upload code to the Arduino microcontroller. It is essential for programming the sensor's functionality and handling the data it collects.
- Processing: A flexible software sketchbook and language for learning how to code within the context of the visual arts. In this project, Processing was employed to enhance data visualization, providing a clear graphical representation of the heart rate signals detected by the sensor.
- Code References: The programming part of this project involved referencing and adapting multiple codes from related projects found online. This integration helped refine the device's functionality and improve its accuracy. For more detailed information on the specific programs referenced, please see the References section of this wiki page.
Measurements
Procedure
The following steps outline the process for setting up and using the DIY optical heart rate monitor:
- Sensor Assembly: Assemble the pulse sensor, Arduino UNO, and LCD display using jumper wires to establish the necessary connections.
- Computer Connection: Connect the assembled device to a computer or laptop via a USB cable.
- Software Upload: Upload the pulse detection code to the Arduino using the Arduino Integrated Development Environment (IDE) to enable signal processing.
- Initial Testing: Utilize the Arduino IDE's serial plotter to observe and assess the pulse signal initially to ensure proper operation.
- Fingertip Detection: Place the fingertip on the pulse sensor and observe the sensor's response. Record the signal and BPM (beats per minute) data displayed on the LCD and the software.
- Earlobe Testing: Switch the detection position from the fingertip to the earlobe to compare signal quality and response.
- Data Recording: Observe and systematically record the signal patterns and BPM values from the earlobe detection to assess consistency and clarity.
Expected Results
The project is designed to validate several key outcomes:
- Pulsatile Waveform Detection: It is expected to capture a distinct pulsatile waveform in the raw data, corresponding directly to the heartbeat, visible as a consistent graphical representation on the Arduino serial plotter.
- Consistency Across Detection Sites: BPM values and signal patterns are anticipated to remain consistent between different detection sites (fingertip and earlobe), underscoring the sensor's reliability and versatility.
- Variation in Signal Clarity and Noise: While signals are expected to show similar patterns, variations in signal clarity and noise levels may be evident between detection sites. These findings will inform potential improvements in sensor placement and design.
- Heart Rate Range Validation: The expected heart rate range for individuals aged 10 and above is 60 to 100 bpm during rest, aligning with established physiological norms. This range will help confirm the accuracy of the heart rate measurements obtained with the device.
Results
Heart Rate Variability
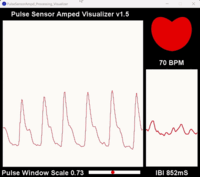
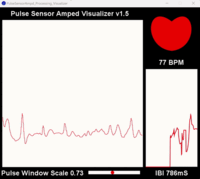
Observational data confirm that the BPM values recorded range from 65 to 80, aligning with the established normal resting heart rate for healthy adults. Additionally, it is noticeable that emotional responses such as anger and laughter were observed to influence the BPM, indicative of the physiological impact of various emotional states on heart rate.
Impact of Emotional States on BPM
The experimentation highlighted that different emotional states significantly alter heart rate dynamics. For instance, moments of anger and laughter were consistently associated with increases in BPM, underscoring the sensitivity of the optical heart rate monitor to detect physiological responses driven by emotional changes.
Comparison of Signal Clarity: Earlobe vs. Fingertip
A key finding from the testing phase is the difference in signal clarity between two common measurement sites: the earlobe and the fingertip. The data revealed that the signal from the earlobe was substantially clearer and more consistent than that obtained from the fingertip. This can be attributed to the earlobe's reduced exposure to ambient light and potentially less physiological interference such as skin thickness and peripheral circulation issues, which are more pronounced in fingertips.
Due to the superior quality of the data obtained from the earlobe, all further detailed analyses and presentations of results utilize signals sourced from this location.
Conclusion
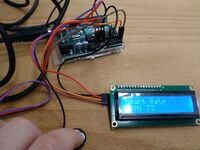
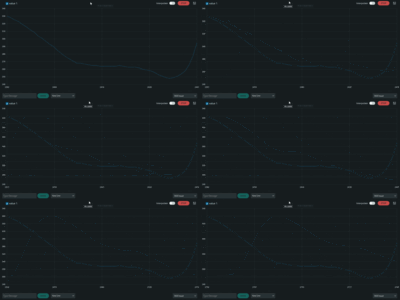
The results not only confirm the functionality and sensitivity of the DIY optical heart rate monitor but also enhance understanding of the practical applications of photoplethysmography (PPG) in detecting emotional and physiological changes. The findings regarding the optimal detection site pave the way for improved design and application of such devices in personal health monitoring. For more details, please take a look at the following images and gif files.
 |
 |
 |
 |
Discussion
Observations on Fingertip vs. Earlobe Signal Quality
During experimentation, the hand-made optical pulse sensor demonstrated consistently clearer and more robust signals when used on the earlobe compared to fingertip readings. The earlobe waveforms exhibited greater amplitude and less noise interference.
Factors Influencing Signal Quality
- Physiological Differences: The earlobe may have a higher density of suitable blood vessels compared to the fingertip, leading to stronger variations in light absorption with each heartbeat. Additionally, thicker skin or calluses on the fingertips can diminish the sensor's signal.
- Ambient Light Interference: The fingertip is more exposed to ambient light, which could introduce increased noise into the sensor's readings compared to the less light-exposed earlobe environment.
- Sensor Pressure: Variations in pressure applied to the fingertip can significantly affect blood flow patterns and, therefore, the detected signal. Sensor placement on the earlobe might be naturally more consistent in terms of pressure.
Potential Strategies for Improving Fingertip Readings
- Sensor Placement Optimization: Extensive experimentation with different sensor positions along the fingertip is necessary to identify areas with the strongest signal.
- Pressure Adjustment: Examine the effect of varying sensor pressure on the fingertip. Both insufficient and excessive pressure can negatively impact the signal.
- Ambient Light Shielding: Develop a simple shield (e.g., cardboard or opaque tape) to reduce ambient light interference on the fingertip and sensor.
- Signal Processing: Implement filtering algorithms within the Arduino code (such as a moving average filter) to reduce noise and enhance signal clarity.
Potential Extensions: Emotional Impact and Lie Detection
Observations indicate that different emotions may affect the BPM values recorded by our optical heart rate monitor. This raises an interesting possibility of extending the use of the device beyond simple heart rate monitoring, potentially employing it in scenarios where emotional responses are relevant, such as lie detection. However, several key challenges must be considered:
- Specificity of Heart Rate Changes: Heart rate can be influenced by a variety of factors, including stress, anxiety, excitement, or physical activity, not just deceit. The non-specific nature of heart rate changes makes it unreliable as a sole indicator of lying.
- Complexity of Lie Detection: Reliable lie detection requires analysis of multiple physiological signals (e.g., skin conductivity, facial expression analysis) beyond just heart rate.
- Ethical Considerations: The use of biometric data for lie detection raises significant ethical concerns, particularly regarding privacy, consent, and the potential for misuse.
Therefore, while the notion of using the heart rate monitor as a part of a lie detection system is intriguing, further research and development would be required to assess its viability, accuracy, and ethical implications.
References
- Arduino 101 CurieBLE Heart Rate Monitor - Official Arduino documentation for a heart rate monitor project using the CurieBLE library.
- Monitor the Heart Rate using Pulse Sensor and Arduino - A tutorial on how to monitor heart rate using a pulse sensor with Arduino, provided by Last Minute Engineers.
- Pulse Rate (BPM) Monitor using Arduino & Pulse Sensor - A detailed guide on setting up a pulse rate monitor using Arduino and a pulse sensor from How2Electronics.
- Pulsesensor.com - The official Pulse Sensor website, which also provides Processing software code used in this project for visualizing heart rate data.