Gas sensor: Difference between revisions
No edit summary |
|||
| Line 40: | Line 40: | ||
=Report= | |||
=Introduction= | ==Introduction== | ||
'''Band Theory''' | '''Band Theory''' | ||
| Line 122: | Line 122: | ||
The National Environmental Agency (NEA) recommends indoor CO<sub>2</sub> levels that should ideally not exceed 800 ppm. Thus, the ability to measure and control carbon dioxide levels is crucial for maintaining indoor air quality and protecting human health. | The National Environmental Agency (NEA) recommends indoor CO<sub>2</sub> levels that should ideally not exceed 800 ppm. Thus, the ability to measure and control carbon dioxide levels is crucial for maintaining indoor air quality and protecting human health. | ||
=Experimental Procedure= | |||
Revision as of 23:28, 26 April 2024
Introduction
The semiconductor gas sensor for carbon monoxide/combustible gas detection uses a gas-sensitive material, tin dioxide (SnO2), which has a low conductivity in clean air. The high and low-temperature cycle detection method is used to detect carbon monoxide at low temperature (1.5V heating), where the conductivity of the sensor increases with the concentration of carbon monoxide gas in the air, and to detect the combustible gases methane and propane at high temperature (5.0V heating), and to clean up the stray gases that are adsorbed at low temperature. A simple circuit is used to convert the change in conductivity to an output signal corresponding to the concentration of the gas.
Team Members
Fu Xinming, Ge Yexiao, Yang Haoqing
Setup
The diagram above shows the basic test circuit for the sensor. The sensor requires two voltages to be applied: the heater voltage (VH) and the test voltage (VC). VH is used to provide the sensor with a specific operating temperature and VC is used to determine the voltage (VRL) across the load resistor (RL) connected in series with the sensor. VC is used to determine the voltage (VRL) across the load resistor (RL) in series with the sensor. The sensor has a slight VC requires a DC power supply. VC and VH can be used as long as the electrical requirements of the sensor are met. VC and VH can share the same power supply circuit if the electrical requirements of the sensor are met. To take advantage of the sensor's performance of the sensor, it is necessary to select the appropriate RL value.
Equipment
Gas Sensitive Components
One-chip computer/microcontroller
ADC conversion module
Datasheets
Gas Sensor ENS160_Datasheet
Temperature Sensor Temperature sensor
Timeline and Milestone
| Week 8 (3/4 — 3/8) | Debug sensor module hardware devices and software code | |
| Week 9 — Week 10(3/11 — 3/22) | Measurements using gas sensors to obtain a database | |
| Week 11 — Week 12(3/25 — 4/5) | Fit curve to obtain the corresponding relationship between the output value and the gas concentration | |
| Week 13 (4/8 — 4/12) | Analyze experimental results and complete reports |
Expected Results
We hope to obtain a curve between the output value and the corresponding gas concentration, so as to know the pollution situation in the environment relatively accurately.
Report
Introduction
Band Theory
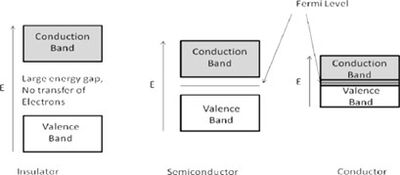
Band theory explains that within a crystal lattice, there exists a valence band and a conduction band separated by an energy gap, which is closely related to the Fermi level. The Fermi level is defined as the highest energy level occupied by electrons at absolute zero temperature. Based on the size of the energy gap between these bands, materials are classified into three main categories:

Insulators: These materials have a substantial gap between the valence and conduction bands, typically around 10 eV or more. Due to this large gap, a significant amount of energy is needed to move an electron into the conduction band, resulting in negligible electronic conduction. At zero temperature, the Fermi level represents the highest filled state.
Semiconductors: These materials feature an energy gap ranging from about 0.5 to 5.0 eV. Below the Fermi level, electrons do not have enough energy to bridge this gap, preventing conduction. However, once the energy exceeds the Fermi level, electrons can transition to the conduction band, leading to increased electrical conductivity.
Conductors: In conductors, the Fermi level is positioned within the conduction band itself, allowing for continuous electron flow and high conductivity.
Band Theory in Gas Sensors
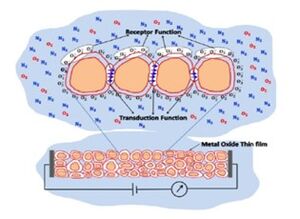
Band theory has played a crucial role in understanding the functionality of gas sensors for several years. In this context, the interaction between a target gas and a metal oxide film's surface—typically involving surface adsorbed oxygen ions—causes a shift in the material's charge carrier concentration. This shift subsequently affects the material's conductivity or resistivity.
For n-type materials, oxidizing gases increase the resistance of the thin film, while reducing gases decrease it. The opposite is true for p-type materials. This interaction, involving oxidation-reduction (REDOX) reactions, alongside the transduction function, defines the chemiresistive behavior of these sensors. Metal oxide sensors are commonly configured as sintered pellets or as thick and thin films. The specific geometry of the crystallites and their interconnections significantly influence these receptor and transduction functions, highlighting the impact of nanotechnology in enhancing sensor performance by manipulating materials at the atomic and molecular scale.
On the other hand, p-type semiconductors, where positive holes are the majority charge carriers, exhibit increased conductivity in the presence of an oxidizing gas, which augments the number of positive holes. Conversely, the presence of a reducing gas increases the material's resistance by introducing negative charge that diminishes the concentration of positive charge carriers (holes). The various responses of these materials to different gases are summarized in Table 1.
| Classification | Oxidising Gases | Reducing Gases |
|---|---|---|
| n-type | Resistance increase | Resistance decrease |
| p-type | Resistance decrease | Resistance increase |

The chemiresistance of metal oxides is also linked to the width of the space charge region that forms on the crystallites due to electron transfer during the adsorption and desorption of gas molecules. This space charge region creates a potential barrier that affects conduction between the grains, leading to changes in the Fermi level. In n-type materials, the interaction with oxidizing gases causes the energy bands to bend upward as electrons are depleted, whereas with reducing gases, the bands bend downward due to electron accumulation. Thus, the space charge region and band bending are closely related to the carrier concentrations within the grain, which are influenced by the grain's size and shape.
Why carbon dioxide?
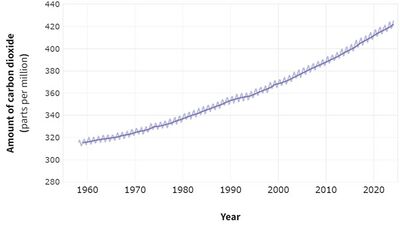
As of March 2024, carbon dioxide concentrations in the Earth's atmosphere were recorded at 425 ppm. Carbon dioxide is utilized in a variety of ways including in carbonated beverages, pneumatic systems, fire extinguishers, and as a critical component for photosynthesis. Additionally, it is used in lasers and refrigeration systems, both naturally and in human applications.

Carbon dioxide also acts as a greenhouse gas, absorbing infrared energy from the atmosphere. This absorption causes the gas to vibrate, subsequently transferring heat to the surrounding air and raising the ambient temperature. Increased levels of carbon dioxide can lead to higher temperatures. Therefore, accurate and reliable sensors that can operate within appropriate temperature ranges are crucial for monitoring changes in atmospheric carbon dioxide concentrations. The recent rise in carbon dioxide levels, primarily due to human activities such as the combustion of hydrocarbons and other carbon-containing fuels like coal, methane, petrol, and kerosene, has heightened concerns about its contribution to global warming. Such activities, when combined with oxygen, produce carbon dioxide and water. Monitoring the emissions of CO2 during these combustion processes is vital as it provides essential real-time data on the quantity of carbon dioxide being emitted.
| CO2 Concentration and Exposure time | Effect on Health (symptoms) |
|---|---|
| 0.035% | Approximate atmospheric concentration, no noticeable effect. |
| 3.3–5.4% for 15 mins | Increased depth of breathing |
| 7.5% for 15 mins | Feeling of an inability to breathe, increased pulse rate, headache, dizziness, sweating, restlessness, disorientation, and visual distortion. |
| 3%, for over 15 hours | Decreased night vision, colour sensitivity |
| 10%, 1.5 mins | Eye flickering, increased muscle activity, twitching |
| 10+% | Difficulty in breathing, impaired hearing, nausea, vomiting, a strangling sensation, sweating, after 15 minutes a loss of consciousness. |
| 30% | Unconsciousness, convulsions. Several deaths attributed to CO2 at concentrations of more than 20% |
Since 1958, atmospheric carbon dioxide levels have consistently increased and are expected to continue rising as long as there is a demand for fossil fuel combustion. High concentrations of carbon dioxide can have significant adverse health effects, including drowsiness and, at very high levels, suffocation.
The National Environmental Agency (NEA) recommends indoor CO2 levels that should ideally not exceed 800 ppm. Thus, the ability to measure and control carbon dioxide levels is crucial for maintaining indoor air quality and protecting human health.