Simple Optical Heart Rate Monitor: Difference between revisions
No edit summary |
|||
| Line 8: | Line 8: | ||
==Mechanism== | ==Mechanism== | ||
The simple optical heart rate monitor functions based on the principle of photoplethysmography (PPG). This technique utilizes a light source (an LED) and a photodetector to measure subtle changes in blood volume within tissue. The LED illuminates the fingertip or earlobe, and the photodetector measures the amount of light that passes through. As the heart beats, the volume of blood in the illuminated area changes, influencing the amount of light reaching the photodetector. These fluctuations in light intensity are analyzed by a microcontroller to calculate the heart rate in beats per minute (BPM). | |||
==Setup== | ==Setup== | ||
Revision as of 23:17, 21 April 2024
Here are some thoughts about the project
Team members
Yang Meng Ting
Idea
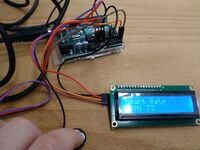
Photoplethysmography is a non-invasive optical technique used in commercial wearables and pulse oximeters to monitor heart rate. Our goal is to reproduce the core concept with a simple DIY device to gain a better understanding of this technology.
Mechanism
The simple optical heart rate monitor functions based on the principle of photoplethysmography (PPG). This technique utilizes a light source (an LED) and a photodetector to measure subtle changes in blood volume within tissue. The LED illuminates the fingertip or earlobe, and the photodetector measures the amount of light that passes through. As the heart beats, the volume of blood in the illuminated area changes, influencing the amount of light reaching the photodetector. These fluctuations in light intensity are analyzed by a microcontroller to calculate the heart rate in beats per minute (BPM).
Setup
Equipment
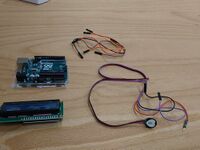
- 1. Pulse Sensor
- 2. An ear clip
- 3. Arduino Uno (microcontroller)
- 4. Jumper wires and cables
- 5. 16X2 I2C LCD Display
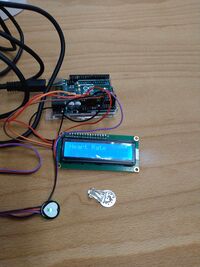
Circuit Overview

Software
- 1. Arduino IDE
- 2. Processing
Measurements
Procedure
1. Assemble the pulse sensor, arduino UNO and LCD display with jumper wires.
2. Connect it with computer/laptop
3. Upload the code to Arduino in order to detect the pulse signal
4. Put the finger tip onto the pulse sensor, it should allow the signal to be detected
5. Record the signal waveform and BPM(beats per minute)
6. Change detection position to earlobe.
7. Record the signal and BPM values.
Expected Results
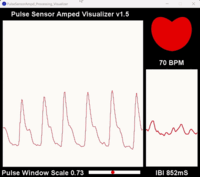
1. A pulsatile waveform corresponding to the heartbeat in the raw data should be detected
2. DIfferent detection position should have the same BPM values and similar signal
3. Although the signals are similar, clarity and noise levels will vary
Results
