Simple Optical Heart Rate Monitor
Here is the report of the experiment and some observations.
Team members
Yang Meng Ting
Idea
Photoplethysmography is a non-invasive optical technique used in commercial wearables and pulse oximeters to monitor heart rate. Our goal is to reproduce the core concept with a simple DIY device to gain a better understanding of this technology.
Mechanism
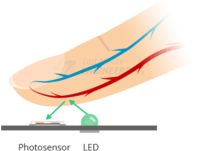
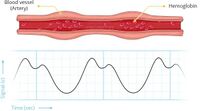
The simple optical heart rate monitor functions based on the principle of photoplethysmography (PPG). This technique utilizes a light source (an LED) and a photodetector to measure subtle changes in blood volume within tissue. The LED illuminates the fingertip or earlobe, and the photodetector measures the amount of light that passes through. As the heart beats, the volume of blood in the illuminated area changes, influencing the amount of light reaching the photodetector. These fluctuations in light intensity are analyzed by a microcontroller to calculate the heart rate in beats per minute (BPM).
 |
 |
Setup
Equipment
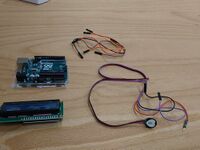
Component List:
|
 |
Circuit Overview
 |
 |
Software
- 1. Arduino IDE
- 2. Processing
Measurements
Procedure
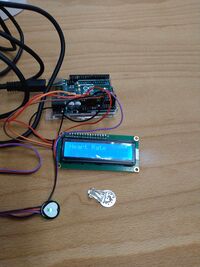
1. Assemble the pulse sensor, arduino UNO and LCD display with jumper wires.
2. Connect it with computer/laptop.
3. Upload the code to Arduino in order to detect the pulse signal.
4. First using Arduino IDE serial plotter to observe the signal for testing.
5. After confirming everything worked well, now put the finger tip onto the pulse sensor for detection.
6. Observe and record the signal and BPM(beats per minute).
7. Change detection position to earlobe.
8. Observe and record the signal and BPM values.
Expected Results
1. A pulsatile waveform corresponding to the heartbeat in the raw data should be detected
2. DIfferent detection position should have the same BPM values and similar signal
3. Although the signals are similar, clarity and noise levels will vary
Results
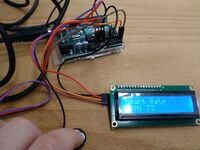 |
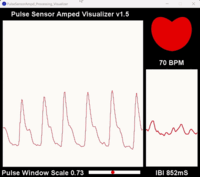 |
 |
Discussion
Observations on Fingertip vs. Earlobe Signal Quality
During experimentation, the hand-made optical pulse sensor demonstrated consistently clearer and more robust signals when used on the earlobe compared to fingertip readings. The earlobe waveforms exhibited greater amplitude and less noise interference.
Factors Influencing Signal Quality
- Physiological Differences: The earlobe may have a higher density of suitable blood vessels compared to the fingertip, leading to stronger variations in light absorption with each heartbeat. Additionally, thicker skin or calluses on the fingertips can diminish the sensor's signal.
- Ambient Light Interference: The fingertip is more exposed to ambient light, which could introduce increased noise into the sensor's readings compared to the less light-exposed earlobe environment.
- Sensor Pressure: Variations in pressure applied to the fingertip can significantly affect blood flow patterns and, therefore, the detected signal. Sensor placement on the earlobe might be naturally more consistent in terms of pressure.
Potential Strategies for Improving Fingertip Readings
- Sensor Placement Optimization: Extensive experimentation with different sensor positions along the fingertip is necessary to identify areas with the strongest signal.
- Pressure Adjustment: Examine the effect of varying sensor pressure on the fingertip. Both insufficient and excessive pressure can negatively impact the signal.
- Ambient Light Shielding: Develop a simple shield (e.g., cardboard or opaque tape) to reduce ambient light interference on the fingertip and sensor.
- Signal Processing: Implement filtering algorithms within the Arduino code (such as a moving average filter) to reduce noise and enhance signal clarity.