Impedance Spectroscopy for Detecting Phase Transitions in KBr
Team members
Laphas Precmcharoen, Song Runlin, Gao Jia
Introduction
This project aims to study the electrical properties of Potassium Bromide (KBr) using impedance spectroscopy.
Materials
1. Electrochemical Impedance Spectroscopy (EIS) System
2. KBr samples
3. Two-electrode system
4. Frequency generator
Procedure
Palletizing KBr
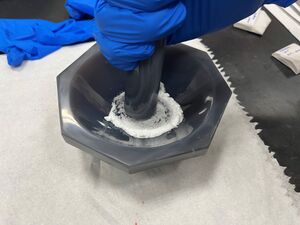
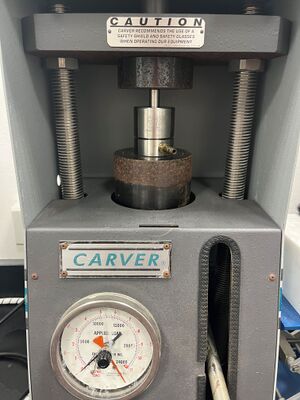
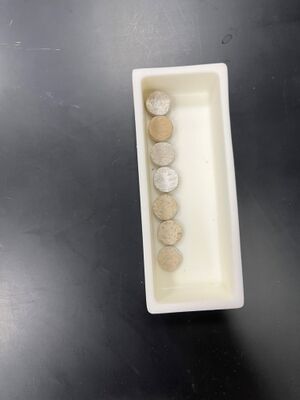
To prepare the KBr for impedance spectroscopy, the powdered KBr was first palletized. This process involved grinding the KBr into powder to achieve a powdery consistency and then compressing under a pressure of approximately 5 tons using a hydraulic press for approximately 3 minutes, forming a compact, disk-shaped pellet with a diameter of 11.4 mm and a thickness of approximately 2.61 mm. The uniform size and shape of the pellet were crucial for ensuring consistent and reliable impedance measurements.{|style="margin: 0 auto;"|

|

|}
Application of Silver Paint
After palletization, both sides of the KBr pellet were coated with a thin layer of silver paint. This step was performed carefully to ensure a uniform conductive layer was formed, minimizing any potential impedance contributions from uneven surface conductivity. The silver-coated pellet was then left to dry for 15 minutes, ensuring the paint was fully set and conductive.

Electrode Setup
Once the silver paint was dry, electrodes were attached to both sides of the pellet. This setup facilitated the application of an alternating current (AC) through the pellet, necessary for impedance measurements. The electrodes were connected to the impedance spectroscopy system.
Impedance Spectroscopy System and Heating
The impedance spectroscopy measurements were conducted using an impedance analyzer capable of capturing impedance data over a broad frequency range. The frequency range for the measurements spanned from 100 Hz to 100,000 Hz, with a total of 60 frequencies measured at evenly spaced logarithmic intervals. This comprehensive frequency range was selected to ensure a detailed characterization of the KBr pellet's impedance properties across different electrical conduction regimes. For the experiment, the KBr pellet, with electrodes attached, was placed in a temperature-controlled chamber within the impedance spectroscopy system. The temperature of the chamber was increased in steps of approximately 10°C, starting from 50°C and reaching up to 250°C. At each temperature step, impedance data were recorded across the predetermined frequency range. This methodical temperature increment allowed for the detailed observation of the KBr pellet's phase transition behavior at each step.
Data Analysis
Impedance data were analyzed and presented as Nyquist plots for each temperature step. Circle fitting techniques were employed on these plots to deduce the conductivity and capacitance values across the temperature spectrum. The analysis focused on both the conductivity times temperature (σT) versus reciprocal temperature (1/T) graph and the log(σ) versus reciprocal (1/T) temperature graph. These analyses aimed to identify shifts in the slopes of these graphs, which are indicative of phase transitions within the KBr pellet. Special emphasis was placed on changes observed around 180°C, where a noticeable shift in the slopes suggested a phase transition.
The choice to analyze the relationship between (σT) and (1/T) is inspired by the seminal work of Suresh Chandra and John Rolfe, as detailed in their paper "Ionic Conductivity of Potassium Bromide Crystals." Their research demonstrated a clear linear relationship between these variables, underscoring the utility of this approach in predicting conductivity across different temperatures and identifying phase transitions.
In addition to the (σT) versus (1/T) analysis, our study also incorporates the log(σ) versus (1/T) graph, underpinned by the Arrhenius equation. The Arrhenius law provides a fundamental description of how reaction rates (or, in our case, conductivity) increase with temperature. By plotting the natural logarithm of the conductivity against the reciprocal of the temperature, we can extract the activation energy for the conduction process within the KBr crystals. This relationship is crucial for understanding the temperature dependence of ionic movement and offers additional evidence of phase transitions, especially when anomalies or deviations from the expected linear trend are observed.
Results
The impedance spectroscopy measurements of potassium bromide (KBr) across the temperature range of 50°C to 250°C resulted in a series of Nyquist plots. Each plot displayed a semi-circular arc, the diameter of which varied with temperature, indicating changes in the material's impedance properties. The circle fitting method was employed to approximate the pellet's conductivity and capacitance values at each temperature step. The circle fitting applied to a selected Nyquist plot is illustrated in Figure 1.
Additionally, the relationship between conductivity, capacitance, and temperature for the KBr pellet was graphically represented, as depicted in Figures 2 and 3. It was observed that the capacitance of KBr remained relatively stable across the temperature range from 50°C to 250°C, suggesting that capacitance measurements are not a reliable indicator of phase transitions within KBr. Conversely, a notable variance in the conductivity of the KBr pellet was recorded over the same temperature range, underscoring the importance of focusing our analysis on the conductivity data.
A graph plotting conductivity times temperature ((\sigma T)) against reciprocal temperature ((1/T)) was constructed and is presented in Figure 4.The graphical representation of conductivity times temperature ((\sigma T)) versus reciprocal temperature ((1/T)) revealed a linear relationship in two distinct segments, separated by a noticeable slope change. The linear fit of these two segments is also delineated in Figure 4. This inflection point, occurring around 180°C, is indicative of a phase transition temperature for KBr. The linearity of the segments before and after the transition point with prior empirical evidence, with a more in-depth discussion on the proposed mechanism for this phase transition provided in the Discussion section.
Similarly, the plot of the logarithm of conductivity (log((\sigma))) against reciprocal temperature ((1/T)) shown in figure 5 exhibited two linear regions intersecting at the same transition temperature of approximately 180°C. This graph further supports the Arrhenius law, indicating a shift in the activation energy for ionic conduction in KBr coinciding with the phase transition. The presence of two straight lines on this graph, indicative of different activation energies before and after the phase transition, provides additional evidence of the structural changes occurring within the KBr crystal lattice.
The identification of a transition temperature around 180°C, consistent across both graphical analyses, highlights the sensitivity of impedance spectroscopy in detecting phase transitions in KBr. This temperature mark serves as a critical point where the material's conductive properties undergo significant changes, likely due to alterations in the crystal structure which will be discussed in more detailed in the discussion section.
Discussion
Conclusion
Timeline
| 5/3 | Learn how to do the Impedance spectrocopy and how to palletize samples | |
| 7/3 | Palletize powdered KBr | |
| 12/3 | Patelletize KBr into different thicknesses | |
| 14/3 | Silver paint both sides of the pallets | |
| 19/3 | 1st attempt on the impedance spectroscopy across different temperatures | |
| 20/3 | final attempt on the impedance spectroscopy across different temperature from 50C - 255C of the pallet with diameter 11.4 mm and thickness 2.61 mm | |
| 21/3 | Do the impedance spectroscopy while applying bias DC voltage from 0V to 5V of the pallet with diameter 11.7 mm and thickness 3.54 mm and do the impedance spectroscopy on the pallets with different thicknesses | |
| 26/3 | Fit the nyquist plot of the temperature data with a semi circle to get approximated resistance and capacitance | |
| 2/4 | Discuss the result and fit the DC dependent data with semi circle | |
| 4/4 | Analyze the data and discuss | |
| 9/4 | Discuss the possible mechanism of phase transition and updating wiki page |