Humidity Sensor of Graphite: Difference between revisions
No edit summary |
|||
| (84 intermediate revisions by the same user not shown) | |||
| Line 10: | Line 10: | ||
In conclusion, carbon-based materials offer exciting prospects for future humidity sensing technologies. By continuously improving their physicochemical properties through nanotechnology and materials engineering, it is possible to develop sensors with greater sensitivity, faster response, and broader adaptability to complex humidity environments. | In conclusion, carbon-based materials offer exciting prospects for future humidity sensing technologies. By continuously improving their physicochemical properties through nanotechnology and materials engineering, it is possible to develop sensors with greater sensitivity, faster response, and broader adaptability to complex humidity environments. | ||
== Experimental Principle== | |||
In this experiment, a layer of graphite was coated onto paper-based substrates. The fiber paper is primarily composed of cellulose, consisting of long chains of glucose units containing hydroxyl (-OH) groups capable of attracting water molecules. When humidity increases, the hydroxyl groups form hydrogen bonds with water molecules, allowing cellulose to absorb moisture. This adsorption process causes the cellulose structure to expand, affecting the spacing and contact points between graphite particles on the surface. | |||
The graphite layer on the paper was applied using a pencil and plays a crucial role in the humidity response of the sensor based on resistance changes. Graphite, composed of layers of carbon atoms and localized electrons, exhibits excellent electrical conductivity. In the resistive humidity sensor, the adsorption of water molecules modifies the graphite network because the adsorbed water molecules alter the connectivity between graphite particles. | |||
Under low humidity conditions, electrical conduction mainly occurs through direct contact between graphite particles, and the sensor exhibits an intrinsic resistance <math>R_0</math>. As humidity rises, a thin layer of water molecules adsorbs onto the surface, initially forming a monolayer. During this monolayer adsorption, water molecules ionize according to: | |||
<center><math>\mathrm{H_2O} \rightleftharpoons \mathrm{H^+} + \mathrm{OH^-}</math></center> | |||
The generation of <math>\mathrm{H^+}</math> and <math>\mathrm{OH^-}</math> ions facilitates charge transport, enhancing the conductivity <math>\sigma</math> and thus decreasing the resistance according to: | |||
<center><math>R = \frac{L}{\sigma A}</math></center> | |||
where <math>L</math> is the effective length and <math>A</math> is the cross-sectional area through which conduction occurs. | |||
As humidity further increases, multilayer adsorption takes place, increasing the thickness of the adsorbed water film. This thick water layer impacts the conductivity in two competing ways: on one hand, the increased number of ions continues to promote conducticonduction and decrease resistance; on the other hand, when the water layer becomes thick enough, it can act as an insulating barrier, interrupting direct electrical pathways between graphite particles and causing the resistance to rise. Thus, due to this competition, the sensor’s resistance exhibits a non-monotonic trend with increasing humidity—initially decreasing and subsequently increasing as the humidity surpasses a certain point. | |||
Additionally, the porous structure of the paper significantly influences the sensor's response. Tiny voids within the cellulose fibers can trap water molecules, leading to localized moisture accumulation. This trapped moisture can either enhance ionic conductivity or disrupt the graphite network, depending on the amount and distribution of absorbed water. Consequently, microscopic changes in water content cause corresponding variations in the effective resistance of the sensor. However, because the evaporation of water trapped within micropores is relatively slow, the recovery time of the sensor may be prolonged after humidity levels drop. | |||
== Objective == | == Objective == | ||
| Line 20: | Line 39: | ||
<b>(4)</b> Data analysis: use Python code to do fitting; get the experimental relationship between Graphite's resistance and humidity; analyze the error. | <b>(4)</b> Data analysis: use Python code to do fitting; get the experimental relationship between Graphite's resistance and humidity; analyze the error. | ||
== | == Equipment Required == | ||
=== DHT11 === | === DHT11 === | ||
The DHT11 is a temperature and humidity composite sensor with calibrated digital signal output, suitable for measuring ambient temperature and humidity. It | The DHT11 is a temperature and humidity composite sensor with calibrated digital signal output, suitable for measuring ambient temperature and humidity. It can be coded with Arduino. Here we use this sensor to get the standard humidity. | ||
=== Basic | ==== Basic Specifications ==== | ||
{| class="wikitable" style="text-align:center; width:60%" | {| class="wikitable" style="text-align:center; width:60%" | ||
| Line 43: | Line 62: | ||
| Humidity Accuracy | | Humidity Accuracy | ||
| ±5% RH | | ±5% RH | ||
|- | |- | ||
| Sampling Period | | Sampling Period | ||
| Line 55: | Line 68: | ||
| Signal Output | | Signal Output | ||
| Digital (single-wire) | | Digital (single-wire) | ||
|} | |} | ||
== Equipment | === Dry box and Desiccant === | ||
A dry box is a sealed container or cabinet designed to maintain a low-humidity environment to protect sensitive items from moisture. It often uses desiccants, electronic dehumidifiers, or nitrogen purging systems to control humidity levels. Dry boxes are commonly used for storing electronics, photographic equipment, laboratory samples, and moisture-sensitive materials to prevent damage such as corrosion, mold growth, or degradation. | |||
A desiccant is a material that absorbs moisture from its surroundings to maintain dryness and prevent damage caused by humidity. Common types include silica gel, calcium chloride, molecular sieves, and activated alumina, each suited for different humidity control needs. They typically work through physical adsorption or chemical reactions to capture water molecules from the air. | |||
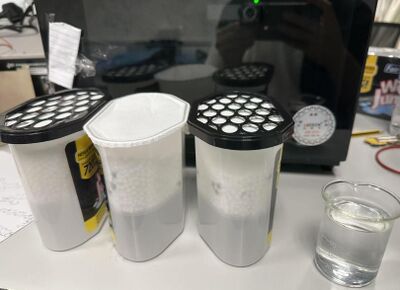
The humidity in the lab is about 60%. The original drying function of dry box can only decrease it to 53% for one hour. We use the dry box as a sealed container to reduce humidity more quickly through the desiccant(about 40% in 15 mins). The humidity rising process is controlled by the hot water vapor. | |||
<center>[[File:Desiccant.jpg|400px]]</center> | |||
<center>'''Dry box and Desiccant'''</center> | |||
=== Arduino === | |||
Arduino is an open-source electronics platform based on easy-to-use hardware and software. It consists of microcontroller boards that can read inputs. In this project, we connect it with DHT11 sensor to read the outputs. Arduino also provides 5V output, we use this as the voltage output of a resistor circuit. | |||
== Equipment Steps == | |||
===Humidity Controlling System=== | |||
To provide a controlled and stable humidity environment for testing experimental samples, we designed a sealed drying chamber. Desiccants were placed inside the chamber to absorb moisture from the air and maintain a low-humidity state. After the humidity is stable, we place a cup of hot water inside the dry box to raise the humidity. | |||
===Fabrication of Graphite Humidity Sensor=== | |||
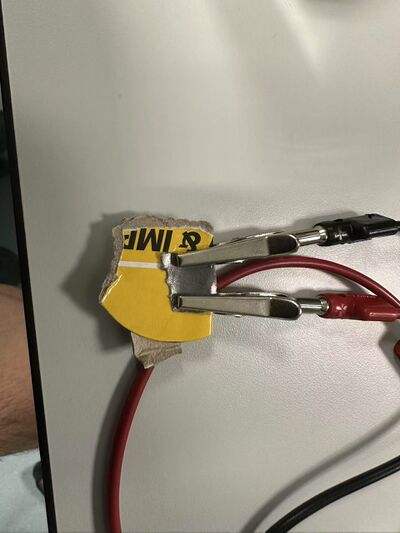
We selected the pencil as the source of graphite and applied it across the entire surface of a rectangle paper through coating. Try to keep the graphite layer flat during this process The paper is adhered to a cardboard substrate, which provided stable support to prevent deformation to the paper during testing. We clamp both ends of the paper with clips and connect the sensor to the external circuit | |||
<center>[[File:S1.jpg|400px]]</center> | |||
<center>'''Graphite Humidity Sensor'''</center> | |||
===Measurement System=== | |||
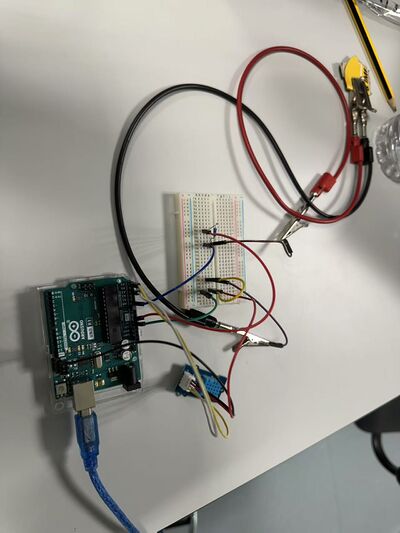
We used an Arduino board to connect the circuit and sensors, receiving digital signals through Arduino software. Python was used to extract and process the signals in real time, simulating the output voltage of the test sample and reading the actual humidity from the reference sensor (DHT11). | |||
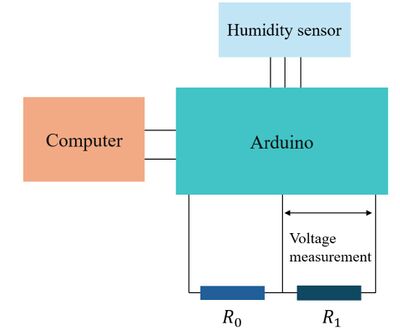
We also use the Arduino as the power supply for resistance measurement circuit. The circuit is shown in the picture below. R0 is the standard resistance. R1 is our sensor and we measure the voltage drop between the sensor. The total voltage Arduino provides is 5V. The resistance of sensor can be calculated by: | |||
<center><math>R_1 = \frac{V}{5-V} \times R_0</math></center> | |||
<center>[[File:Measurement_circuit.jpg|400px]]</center> | |||
<center>'''Measurement Circuit'''</center> | |||
The overall setup: | |||
<center>[[File:Setup_1.jpg|400px]]</center> | |||
<center>'''Measurement Circuit'''</center> | |||
We write the Arduino code to get the each parameters' output and use Python code to record these in a text file. | |||
Arduino code: | |||
#include <DHT.h> | |||
#define DHTPIN A5 | |||
#define DHTTYPE DHT11 | |||
DHT dht(DHTPIN, DHTTYPE); | |||
const int HumiditySensorPin = A0; | |||
int sensorValue = 0; | |||
void setup() { | |||
Serial.begin(9600); | |||
dht.begin(); | |||
} | |||
void loop() { | |||
sensorValue = analogRead(HumiditySensorPin); | |||
float voltage = sensorValue * (5.0 / 1023.0); | |||
float h = dht.readHumidity(); | |||
float t = dht.readTemperature(); | |||
Serial.print("Light Sensor Value: "); | |||
Serial.print(sensorValue); | |||
Serial.print(" | Voltage: "); | |||
Serial.print(voltage); | |||
Serial.println("V"); | |||
Serial.print("Humidity Value: "); | |||
Serial.println(h); | |||
Serial.print("T:"); | |||
Serial.println(t); | |||
delay(5000); | |||
} | |||
Python Code: | |||
import serial | |||
import time | |||
import serial | |||
ser = serial.Serial('COM3', 9600) | |||
file_path = r"D:\arduino\final\data_cooling.txt" | |||
file = open(file_path, "w") | |||
while True: | |||
data = ser.read() | |||
if data: | |||
file.write(data.decode('utf-8')) | |||
file.flush() | |||
== Results == | |||
During the measurement, we record the outputs every 5s. The humidity value, read from DHT11, changes much slower than this time interval. This ensure sufficient dynamic response information was collected. Several voltage value will be recorded for one humidity value. During our data analysis, we use the average of voltage to plot the figures. | |||
===Decrease Humidity=== | |||
First we analyze the resistance during we dry the box with desiccant. This process with last for about 15 mins to decrease the humidity to about 40%. As this process develops quickly, each humidity value only last for few recording rounds. In general, the Graphite Sensor's resistance decreases with the humidity decreasing, which is consistent with the Reference. The curve shows nearly linear relationship with humidity. However the curve is rough and there are serval lifting turning points in the curve. We attributes it to the unstable Graphite Sensor state(long response time). The linear relationship is not the correct. | |||
[[File:Decrease_2.jpg|center|thumb|R Curve with Humidity]] | |||
===Raise Humidity=== | |||
After the humidity finally stable around 40%(the lowest humidity we can get in our system), we put a cup of hot water into the dry box to increase the humidity. This enables us to raise the humidity up to 85% with a relatively slow speed. The curve is shown below: | |||
<center>[[File:Raise.jpg|400px]]</center> | |||
<center>'''Raise Humidity'''</center> | |||
We can see that in general the resistance still increases with humidity. The curve is more smooth compared to decreasing process. This attributes to a longer duration for each humidity value. The Graphite sensor can fully response. However there are still lift turning points below 50% humidity and above 80%. For below 50%, we attribute to the open-door process to put the water inside. This will quickly raise the humidity and make the air in box unstable. The may cause the turning points as the measured humidity is not the real humidity value which Graphite Sensor experiences. For above 80% part, we assume it is over the Graphite Sensor's measurement range. | |||
Based on the assumption above, we do fitting to investigate the relationship between humidity and resistance. The fitting formula is: | |||
<center><math>y = A e^{- \frac{x}{t}} + B</math></center> | |||
where: | |||
* <math>y</math> represents the resistance, | |||
* <math>x</math> represents the humidity, | |||
* <math>A</math>, <math>B</math>, and <math>t</math> are fitting parameters. | |||
The fitting range is from 50% to 80% humidity. | |||
<center>[[File:Fitting.jpg|400px]]</center> | |||
<center>'''Fitting'''</center> | |||
The result shows a good fitting with R^2=0.995. We expect this as the R-H relationship for the Graphite Sensor. | |||
In the | ===Comparison between S1 and S2=== | ||
In the above discussion, we mainly use one sample. We now prepare another Graphite Sensor sample to verify the conclusion. This Sensor has different length compared with S1. This leads to a different resistance range. The R-H curve shows the similar relationship. Below 50% humidity, there is lots of turning points. We do the fitting between 50 to 80% humidity. The result shows R^2=0.997. In conclusion, the exponential function satisfies the R-H curve well. | |||
<center>[[File:Comparsion.jpg|400px]]</center> | |||
<center>'''Comparison between S1 and S2'''</center> | |||
==Discussion== | |||
This study demonstrated the humidity sensitivity of pencil graphite sensors, highlighting their potential for reliable humidity monitoring. The results indicated that the resistance of conventional graphite sensors increased with humidity. Data fitting was applied to establish functional relationships that convert sensor resistance into relative humidity values. | |||
== | ===Error Analysis=== | ||
In our fitting range, there are still tiny turning points. Beyond the influence of opening the door, we now discuss about possible reasons behind this. | |||
<b>(1)</b> When we deal with humidity, we need to pay attention to temperature. Temperature significantly affects the accuracy of humidity sensor measurements. As temperature rises, the saturation vapor pressure increases, leading to lower relative humidity for the same amount of water vapor. Additionally, most humidity sensors, such as capacitive or resistive types, exhibit inherent temperature sensitivity, causing potential drift or slower response. | |||
DHT11 can give the temperature, with <math>\pm 5\ ^\circ \mathrm{C}</math> error. In our Arduino Code, we also record the temperature. It turns out the temperature output shows tiny shift during measurement. The range is between 21.8 to 23.0. This is mainly caused by hot water vapor. This may influence the sensor response. | |||
<b>(2)</b> In the resistance measurement, we use Arduino as the power source. The signal we measure in Arduino is initially shown ass an integer from 0 to 1023. Discrete values limits the sensibility of our resistance measurement. Meanwhile, the 5V output is not stable. We record the voltage between '5V' and 'GND' link on Arduino. The output will shift between 1021 to 1023. The possible reason is Arduino is supplied by the USB interface of our computer. This will influence the resistance calculation. | |||
==Reference== | |||
[1]A. E. Dessler and S. C. Sherwood, “A matter of humidity,” Science 323,1020–1021 (2009). | |||
[2]L. Zipser, H. Franke, and W.-D. Bretschneider, “Robust acoustic humidity sensor for industrial drying,” in SENSORS, 2004 IEEE (IEEE, 2004) pp.107–110. | |||
[3]S. A. Imam, A. Choudhary, and V. K. Sachan, “Design issues for wireless sensor networks and smart humidity sensors for precision agriculture: A review,” in 2015 International Conference on Soft Computing Techniques and Implementations (ICSCTI) (IEEE, 2015) pp. 181–187. | |||
[4]Y. Wu, Q. Huang, J. Nie, J. Liang, N. Joshi, T. Hayasaka, S. Zhao, M. Zhang, X. Wang, and L. Lin, “All-carbon based flexible humidity sensor,” Journal of Nanoscience and Nanotechnology 19, 5310–5316 (2019). | |||
[5]P. Zhu, Y. Liu, Z. Fang, Y. Kuang, Y. Zhang, C. Peng, and G. Chen, “Flexible and highly sensitive humidity sensor based on cellulose nanofibers and carbon nanotube composite film,” Langmuir 35, 4834–4842 (2019). | |||
[ | |||
[6]https://wiki.seeedstudio.com/Grove-TemperatureAndHumidity_Sensor/ | |||
Latest revision as of 09:55, 29 April 2025
Team Member
Xu Ruizhe, Ma Shunyu, Li Zerui, Wei Heyi
Introduction
Humidity sensors play an essential role in fields such as environmental monitoring, industrial process control, agriculture, and healthcare, where accurate humidity measurements are critical. High-quality sensors are necessary to precisely track humidity levels and variations. Traditionally, materials like metal oxides and polymers have been used, but they often suffer from limitations including slow response times, low sensitivity, and limited accuracy.
In recent years, carbon-based materials have gained significant interest due to their unique physical and chemical properties. They offer remarkable features such as high surface area, excellent electrical conductivity, and strong chemical stability across various environments. These advantages make carbon materials highly promising for developing sensitive and reliable humidity sensors. For instance, carbon nanotubes (CNTs) enhance sensor response speed thanks to their large surface area and porosity, while graphene provides ultra-fast signal transduction owing to its thin structure and superior conductivity. Other forms like carbon black and carbon fiber show strong resistance to humidity-induced degradation, ensuring long-term operational stability.
The humidity sensing capability of carbon-based materials largely stems from their interaction with water molecules. Changes in humidity cause adsorption or desorption of water on the material surface, altering properties such as resistance or capacitance. Sensor performance can further be tailored by adjusting material morphology or engineering defects.
In conclusion, carbon-based materials offer exciting prospects for future humidity sensing technologies. By continuously improving their physicochemical properties through nanotechnology and materials engineering, it is possible to develop sensors with greater sensitivity, faster response, and broader adaptability to complex humidity environments.
Experimental Principle
In this experiment, a layer of graphite was coated onto paper-based substrates. The fiber paper is primarily composed of cellulose, consisting of long chains of glucose units containing hydroxyl (-OH) groups capable of attracting water molecules. When humidity increases, the hydroxyl groups form hydrogen bonds with water molecules, allowing cellulose to absorb moisture. This adsorption process causes the cellulose structure to expand, affecting the spacing and contact points between graphite particles on the surface.
The graphite layer on the paper was applied using a pencil and plays a crucial role in the humidity response of the sensor based on resistance changes. Graphite, composed of layers of carbon atoms and localized electrons, exhibits excellent electrical conductivity. In the resistive humidity sensor, the adsorption of water molecules modifies the graphite network because the adsorbed water molecules alter the connectivity between graphite particles.
Under low humidity conditions, electrical conduction mainly occurs through direct contact between graphite particles, and the sensor exhibits an intrinsic resistance . As humidity rises, a thin layer of water molecules adsorbs onto the surface, initially forming a monolayer. During this monolayer adsorption, water molecules ionize according to:
The generation of and ions facilitates charge transport, enhancing the conductivity and thus decreasing the resistance according to:
where is the effective length and is the cross-sectional area through which conduction occurs.
As humidity further increases, multilayer adsorption takes place, increasing the thickness of the adsorbed water film. This thick water layer impacts the conductivity in two competing ways: on one hand, the increased number of ions continues to promote conducticonduction and decrease resistance; on the other hand, when the water layer becomes thick enough, it can act as an insulating barrier, interrupting direct electrical pathways between graphite particles and causing the resistance to rise. Thus, due to this competition, the sensor’s resistance exhibits a non-monotonic trend with increasing humidity—initially decreasing and subsequently increasing as the humidity surpasses a certain point.
Additionally, the porous structure of the paper significantly influences the sensor's response. Tiny voids within the cellulose fibers can trap water molecules, leading to localized moisture accumulation. This trapped moisture can either enhance ionic conductivity or disrupt the graphite network, depending on the amount and distribution of absorbed water. Consequently, microscopic changes in water content cause corresponding variations in the effective resistance of the sensor. However, because the evaporation of water trapped within micropores is relatively slow, the recovery time of the sensor may be prolonged after humidity levels drop.
Objective
(1) Build a a sealed drying chamber: use a dry box; control the humidity by desiccants and hot water.
(2) Monitor the humidity with sensor: use DHT11 sensor to monitor the humidity and temperature inside the chamber; verify the range of humidity.
(3) Measure the resistance of Graphite sensor: use Arduino to measure the resistance; record the data with Python code.
(4) Data analysis: use Python code to do fitting; get the experimental relationship between Graphite's resistance and humidity; analyze the error.
Equipment Required
DHT11
The DHT11 is a temperature and humidity composite sensor with calibrated digital signal output, suitable for measuring ambient temperature and humidity. It can be coded with Arduino. Here we use this sensor to get the standard humidity.
Basic Specifications
| Parameter | Value |
|---|---|
| Temperature Range | 0 – 50°C |
| Temperature Accuracy | ±2°C |
| Humidity Range | 20 – 90% RH |
| Humidity Accuracy | ±5% RH |
| Sampling Period | ≥ 1 second |
| Signal Output | Digital (single-wire) |
Dry box and Desiccant
A dry box is a sealed container or cabinet designed to maintain a low-humidity environment to protect sensitive items from moisture. It often uses desiccants, electronic dehumidifiers, or nitrogen purging systems to control humidity levels. Dry boxes are commonly used for storing electronics, photographic equipment, laboratory samples, and moisture-sensitive materials to prevent damage such as corrosion, mold growth, or degradation.
A desiccant is a material that absorbs moisture from its surroundings to maintain dryness and prevent damage caused by humidity. Common types include silica gel, calcium chloride, molecular sieves, and activated alumina, each suited for different humidity control needs. They typically work through physical adsorption or chemical reactions to capture water molecules from the air.
The humidity in the lab is about 60%. The original drying function of dry box can only decrease it to 53% for one hour. We use the dry box as a sealed container to reduce humidity more quickly through the desiccant(about 40% in 15 mins). The humidity rising process is controlled by the hot water vapor.
Arduino
Arduino is an open-source electronics platform based on easy-to-use hardware and software. It consists of microcontroller boards that can read inputs. In this project, we connect it with DHT11 sensor to read the outputs. Arduino also provides 5V output, we use this as the voltage output of a resistor circuit.
Equipment Steps
Humidity Controlling System
To provide a controlled and stable humidity environment for testing experimental samples, we designed a sealed drying chamber. Desiccants were placed inside the chamber to absorb moisture from the air and maintain a low-humidity state. After the humidity is stable, we place a cup of hot water inside the dry box to raise the humidity.
Fabrication of Graphite Humidity Sensor
We selected the pencil as the source of graphite and applied it across the entire surface of a rectangle paper through coating. Try to keep the graphite layer flat during this process The paper is adhered to a cardboard substrate, which provided stable support to prevent deformation to the paper during testing. We clamp both ends of the paper with clips and connect the sensor to the external circuit
Measurement System
We used an Arduino board to connect the circuit and sensors, receiving digital signals through Arduino software. Python was used to extract and process the signals in real time, simulating the output voltage of the test sample and reading the actual humidity from the reference sensor (DHT11).
We also use the Arduino as the power supply for resistance measurement circuit. The circuit is shown in the picture below. R0 is the standard resistance. R1 is our sensor and we measure the voltage drop between the sensor. The total voltage Arduino provides is 5V. The resistance of sensor can be calculated by:
The overall setup:
We write the Arduino code to get the each parameters' output and use Python code to record these in a text file.
Arduino code:
#include <DHT.h>
#define DHTPIN A5
#define DHTTYPE DHT11
DHT dht(DHTPIN, DHTTYPE);
const int HumiditySensorPin = A0;
int sensorValue = 0;
void setup() {
  Serial.begin(9600);
  dht.begin();
}
void loop() {
  sensorValue = analogRead(HumiditySensorPin);
  float voltage = sensorValue * (5.0 / 1023.0);
  float h = dht.readHumidity();
  float t = dht.readTemperature();
  Serial.print("Light Sensor Value: ");
  Serial.print(sensorValue);
  Serial.print(" | Voltage: ");
  Serial.print(voltage);
  Serial.println("V");
  Serial.print("Humidity Value: ");
  Serial.println(h);
  Serial.print("T:");
  Serial.println(t);
  delay(5000);
}
Python Code:
import serial
import time
import serial
ser = serial.Serial('COM3', 9600)
file_path = r"D:\arduino\final\data_cooling.txt"
file = open(file_path, "w")
while True:
  data = ser.read()
  if data:
    file.write(data.decode('utf-8'))
    file.flush()
Results
During the measurement, we record the outputs every 5s. The humidity value, read from DHT11, changes much slower than this time interval. This ensure sufficient dynamic response information was collected. Several voltage value will be recorded for one humidity value. During our data analysis, we use the average of voltage to plot the figures.
Decrease Humidity
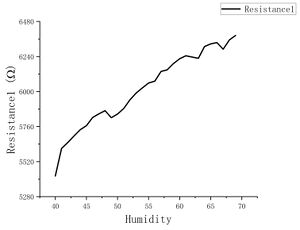
First we analyze the resistance during we dry the box with desiccant. This process with last for about 15 mins to decrease the humidity to about 40%. As this process develops quickly, each humidity value only last for few recording rounds. In general, the Graphite Sensor's resistance decreases with the humidity decreasing, which is consistent with the Reference. The curve shows nearly linear relationship with humidity. However the curve is rough and there are serval lifting turning points in the curve. We attributes it to the unstable Graphite Sensor state(long response time). The linear relationship is not the correct.
Raise Humidity
After the humidity finally stable around 40%(the lowest humidity we can get in our system), we put a cup of hot water into the dry box to increase the humidity. This enables us to raise the humidity up to 85% with a relatively slow speed. The curve is shown below:
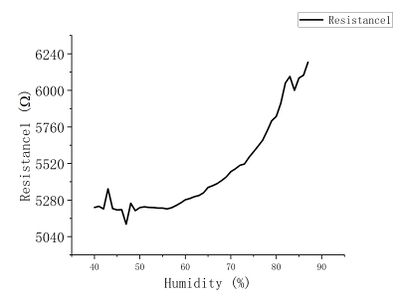
We can see that in general the resistance still increases with humidity. The curve is more smooth compared to decreasing process. This attributes to a longer duration for each humidity value. The Graphite sensor can fully response. However there are still lift turning points below 50% humidity and above 80%. For below 50%, we attribute to the open-door process to put the water inside. This will quickly raise the humidity and make the air in box unstable. The may cause the turning points as the measured humidity is not the real humidity value which Graphite Sensor experiences. For above 80% part, we assume it is over the Graphite Sensor's measurement range.
Based on the assumption above, we do fitting to investigate the relationship between humidity and resistance. The fitting formula is:
where:
- represents the resistance,
- represents the humidity,
- , , and are fitting parameters.
The fitting range is from 50% to 80% humidity.
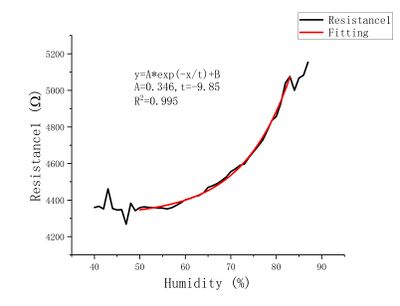
The result shows a good fitting with R^2=0.995. We expect this as the R-H relationship for the Graphite Sensor.
Comparison between S1 and S2
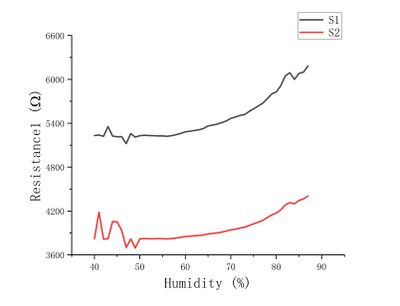
In the above discussion, we mainly use one sample. We now prepare another Graphite Sensor sample to verify the conclusion. This Sensor has different length compared with S1. This leads to a different resistance range. The R-H curve shows the similar relationship. Below 50% humidity, there is lots of turning points. We do the fitting between 50 to 80% humidity. The result shows R^2=0.997. In conclusion, the exponential function satisfies the R-H curve well.
Discussion
This study demonstrated the humidity sensitivity of pencil graphite sensors, highlighting their potential for reliable humidity monitoring. The results indicated that the resistance of conventional graphite sensors increased with humidity. Data fitting was applied to establish functional relationships that convert sensor resistance into relative humidity values.
Error Analysis
In our fitting range, there are still tiny turning points. Beyond the influence of opening the door, we now discuss about possible reasons behind this.
(1) When we deal with humidity, we need to pay attention to temperature. Temperature significantly affects the accuracy of humidity sensor measurements. As temperature rises, the saturation vapor pressure increases, leading to lower relative humidity for the same amount of water vapor. Additionally, most humidity sensors, such as capacitive or resistive types, exhibit inherent temperature sensitivity, causing potential drift or slower response.
DHT11 can give the temperature, with error. In our Arduino Code, we also record the temperature. It turns out the temperature output shows tiny shift during measurement. The range is between 21.8 to 23.0. This is mainly caused by hot water vapor. This may influence the sensor response.
(2) In the resistance measurement, we use Arduino as the power source. The signal we measure in Arduino is initially shown ass an integer from 0 to 1023. Discrete values limits the sensibility of our resistance measurement. Meanwhile, the 5V output is not stable. We record the voltage between '5V' and 'GND' link on Arduino. The output will shift between 1021 to 1023. The possible reason is Arduino is supplied by the USB interface of our computer. This will influence the resistance calculation.
Reference
[1]A. E. Dessler and S. C. Sherwood, “A matter of humidity,” Science 323,1020–1021 (2009).
[2]L. Zipser, H. Franke, and W.-D. Bretschneider, “Robust acoustic humidity sensor for industrial drying,” in SENSORS, 2004 IEEE (IEEE, 2004) pp.107–110.
[3]S. A. Imam, A. Choudhary, and V. K. Sachan, “Design issues for wireless sensor networks and smart humidity sensors for precision agriculture: A review,” in 2015 International Conference on Soft Computing Techniques and Implementations (ICSCTI) (IEEE, 2015) pp. 181–187.
[4]Y. Wu, Q. Huang, J. Nie, J. Liang, N. Joshi, T. Hayasaka, S. Zhao, M. Zhang, X. Wang, and L. Lin, “All-carbon based flexible humidity sensor,” Journal of Nanoscience and Nanotechnology 19, 5310–5316 (2019).
[5]P. Zhu, Y. Liu, Z. Fang, Y. Kuang, Y. Zhang, C. Peng, and G. Chen, “Flexible and highly sensitive humidity sensor based on cellulose nanofibers and carbon nanotube composite film,” Langmuir 35, 4834–4842 (2019).
[6]https://wiki.seeedstudio.com/Grove-TemperatureAndHumidity_Sensor/