Blood Oxygen Sensor: Difference between revisions
| Line 112: | Line 112: | ||
[[File:Group_A_Dataset1_Red_IR.png|800px|thumb|center|Figure 7: Red and IR waveforms for Group A - Dataset 1 ]] | [[File:Group_A_Dataset1_Red_IR.png|800px|thumb|center|Figure 7: Red and IR waveforms for Group A - Dataset 1 ]] | ||
[[File:Group_A_Dataset2_Red_IR.png|800px|thumb|center|Figure 8: Red and IR waveforms for Group A - Dataset 2 ]] | |||
From the figure above, we identified the AC values. Using the formula mentioned earlier, the corresponding R values and calculated blood oxygen levels are shown in the table below. | From the figure above, we identified the AC values. Using the formula mentioned earlier, the corresponding R values and calculated blood oxygen levels are shown in the table below. | ||
Revision as of 16:51, 21 April 2025
Team members
He Lingzi: e1352952@u.nus.edu
Xu Yintong: e1127400@u.nus.edu
Zhao Lubo: e1127502@u.nus.edu
Zhang Ruoxi: e1350111@u.nus.edu
Idea
This project aims to build a sensor to detect the oxygen concentration in the blood.
Blood oxygen sensors typically operate on optical principles. The most common type of blood oxygen sensor is the pulse oximetry (SpO2) sensor. The SpO2 sensor utilizes the light absorption characteristics to measure the oxygen saturation level of hemoglobin. It works by emitting two different wavelengths of light (usually red and infrared) through the skin into the blood, and then measuring the intensity of the light that is reflected back through the skin using corresponding photoelectric sensors. Based on the difference in absorption of red and infrared light, the oxygen saturation level in the blood can be calculated.
Introduction and Principle
...
Experimental Setup
Equipment used
- Photodiode: S5971 - used for detecting transmitted light.
- Operational Amplifier: OPA177 - configured for amplification of the photodiode signal.
- Resistor: Install a 150k ohm resistor between the amplifier's output and the ground to adjust the gain of the amplifier based on the expected light intensity.
- LEDs: 660 nm (red) and 940 nm (infrared) wavelengths – used for measuring the absorption characteristics of oxygenated and deoxygenated hemoglobin.
- Function Generator: Tektronix AFG1022 – used to drive the LEDs.
- Oscilloscope: R&S RTE2004 – used to observe the photodiode output signal.
- Power Supply: Keithley 2231A-30-3 – configured to provide ±6 V.
- Commercial Oximeter – used for reference comparison.
Circuit Setup
1. Photodiode and Amplifier Connection
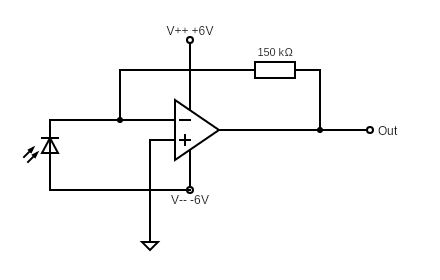
The S5971 photodiode is reverse-biased and connected to the inverting input of the OPA177 operational amplifier. A 150 kΩ feedback resistor is used between the output and the inverting input of the op-amp, forming a transimpedance amplifier. This configuration converts the small photocurrent generated by the photodiode into a readable voltage output.
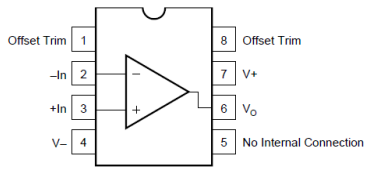
8-Pin Op-Amp Pinout Description is shown below:
The circuit diagram is shown below:
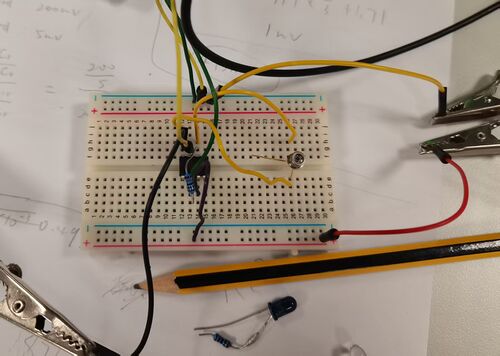
2. Power Supply Configuration
The Keithley power supply only provides positive voltages. To generate a dual supply of ±6 V, two +6 V outputs were connected in series:
Connect the ground of one channel to the +6 V of the other. The remaining terminals act as +6 V and –6 V relative to the common ground. This provides a symmetric ±6 V supply for the op-amp.
3. LED Driving Signal
The 660 nm and 940 nm LEDs are driven by a square wave signal generated by the function generator:
- Frequency: 500 Hz
- Amplitude: 5 V (peak-to-peak)
- Offset: +2.5 V
The offset ensures that the entire waveform stays within the positive voltage range (0–5 V), which simplifies interfacing and avoids negative voltages across the LED.
Signal Observation
The amplified signal from the op-amp is connected to the digital oscilloscope to observe the voltage waveform corresponding to the modulated LED signal. This helps in analyzing the absorption changes related to blood oxygen levels.
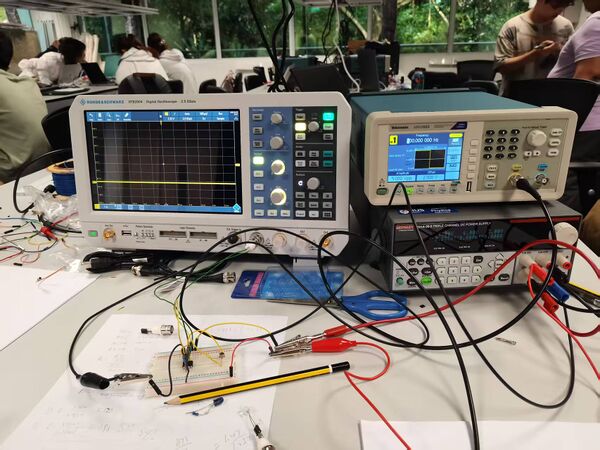
The total experimental setup is shown in the picture below:
During the experiment, a finger was placed directly over the optical sensor, allowing the modulated LED light (660 nm and 940 nm) to shine through the finger. The photodiode detected variations in light intensity corresponding to blood volume changes with each heartbeat.
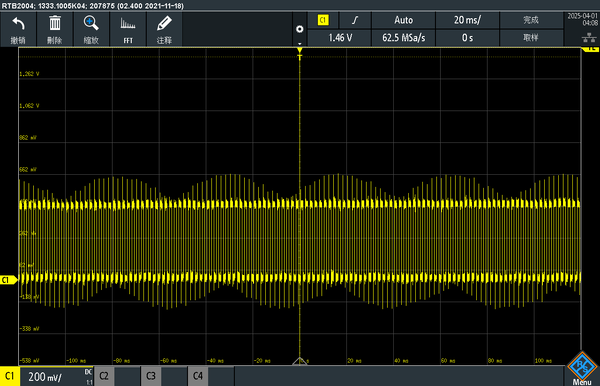
The output of the amplifier was connected to the oscilloscope, and the resulting signal is shown below:
Signal Interpretation
- The high-frequency square wave comes from the modulated LED drive signal (500 Hz).
- The envelope (slow modulation) shows a pulsatile waveform, which correlates with the heartbeat.
- The peak-to-peak voltage ranges from approximately −1.2 V to +1.2 V, indicating good signal strength after amplification.
- This waveform demonstrates the periodic blood volume changes in the finger, confirming successful detection of the photoplethysmographic (PPG) signal.
Measurements and Analyzing Data
1. Calculate the R Value
Blood oxygen saturation is typically determined by first obtaining the R value. To calculate the R value in dual-wavelength PPG, red and infrared light are used. For each wavelength, extract the AC and DC components: . The R value is calculated using the following formula:
This R value represents the relative light absorption associated with arterial blood.
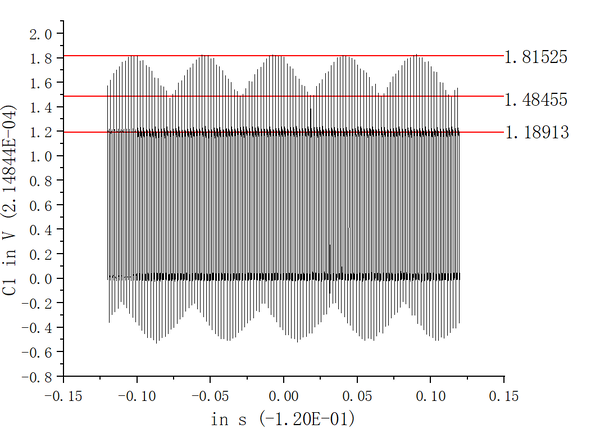
In the experiment, we obtained the AC and DC values using the following method. We exported the waveform image from the oscilloscope and reconstructed it in Origin. By fitting straight lines to approximate the peaks, troughs, and baseline, we obtained the average values. The DC component corresponds to the baseline level of the signal, which can be seen as the lowest line in the figure, with a value of 1.18913. The AC component is the difference between the peak and the baseline. As shown in the figure, it is the difference between the highest line at 1.81525 and the middle line at 1.48455.
2. Estimating SpO₂ from the R Value
Because standard devices measure SpO₂ mostly between 98% and 99%, low-oxygen data is hard to obtain, making it difficult to model the full R–SpO₂ relationship and preventing accurate fitting or simulation.
In this experiment, to calculate blood oxygen saturation, we referred to the empirical fitting formula provided by MAXIM based on its sensor. This formula was obtained by fitting a large amount of experimental data and establishes a relationship between the R value and SpO₂, expressed as:
In our data processing, we adopted this fitting formula as the basis for calculation in order to simplify the analysis and obtain effective SpO₂ estimates.
3. Data Processing
Blood oxygen levels were measured from two individuals, each with three trials. Oscilloscope waveforms were imported into Origin to calculate R values, which were then used to compute SpO₂. After calculating the variance, poor-quality data were excluded to improve accuracy. The remaining values were then averaged to obtain reliable results. The results were compared with readings from a fingertip pulse oximeter.
The figure below shows the waveform plotted in Origin based on the oscilloscope data.
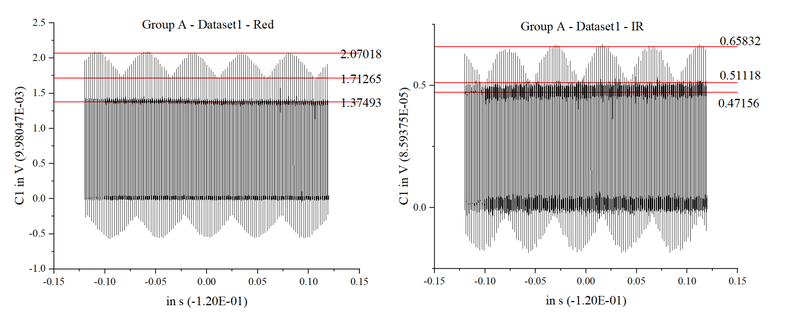
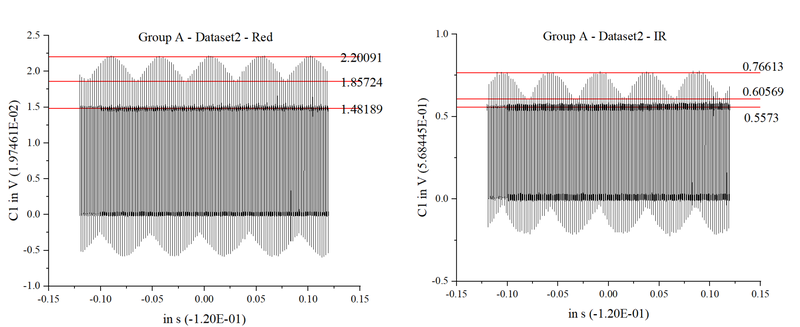
From the figure above, we identified the AC values. Using the formula mentioned earlier, the corresponding R values and calculated blood oxygen levels are shown in the table below.
The average SpO₂ values for groups A and B are 97.780 and 96.624, respectively. Using the variance formula:
the variances of groups A and B are calculated to be 1.385 and 4.122, respectively.
After removing one set of poor-quality data and calculating the average, the result is compared with the measured blood oxygen value:
By comparing the experimental and measured SpO₂ values, we observe that both groups A and B show minimal deviations (–0.976 and –0.957, respectively), with errors under 1%. This demonstrates that our experimental procedure is both accurate and reliable, providing a close approximation to actual blood oxygen saturation levels and validating the effectiveness of our measurement and calculation approach.
P.S. In fact, we conducted experiments on more datasets beyond just groups A and B. However, the performance of the other datasets was not as good, mainly due to excessively large variances or significant deviations from the actual measured values.
Results, Comparison and Improvement
....
References
[1] OPA177 Precision Operational Amplifier Datasheet. Texas Instruments (PDF).