Laser Distance Measurer: Difference between revisions
| Line 58: | Line 58: | ||
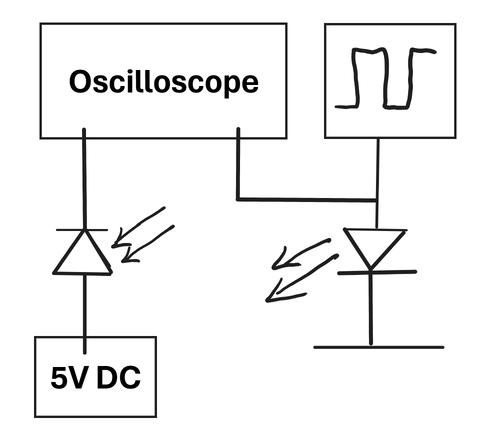
[[File:Laser_Diode_Experiment_setup_final.png|500px|thumb|centre|Schematic of experiment setup. If the photodiode is in line with and can receive light from the LED, two waveforms (one from the source LED and one from the photodiode) will be shown on the oscilloscope.]] | [[File:Laser_Diode_Experiment_setup_final.png|500px|thumb|centre|Schematic of experiment setup (without mirror). If the photodiode is in line with and can receive light from the LED, two waveforms (one from the source LED and one from the photodiode) will be shown on the oscilloscope.]] | ||
{| style="border:none; margin:auto; text-align:center;" | {| style="border:none; margin:auto; text-align:center;" | ||
Revision as of 19:53, 28 April 2025
Group Members
Arya Chowdhury, Liu Sijin, Jonathan Wong
Background and Theory
Equipment List
- Oscilloscope
- Function generator that can output square wave signal (model used: Tektronix AFG1022)
- DC power supply for photodetector (model used: Keithley 2231A-30-3)
- Hamamatsu S5971 silicon photodetector
- 650 nm (red) LED
- Aspheric lens mounted on the LED
- Mirror
- Translation stage
- Optical breadboard, postholders and screws
- Ruler or measuring tape
- BNC cables
Experimental Work
Laser Modulation and System Initialisation
Configure the function generator (Tektronix AFG1022) to output a 10 MHz square wave with an amplitude of 0–3.1 V (High level: 3.1 V, Low level: 1.0 V, output impedance: 50 Ω) to modulate the laser diode. Use the Keithley 2231A-30-3 DC power supply to provide 5.0 V to the laser driver circuit, with a current limit of 30 mA. Verify the laser beam stability to avoid multimode noise or thermal drift that could distort the modulation waveform.
Optical Alignment
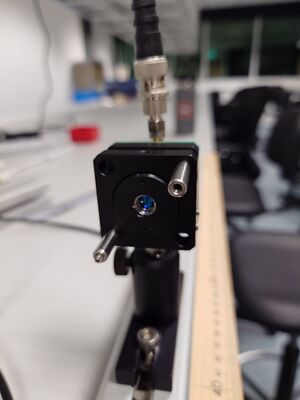
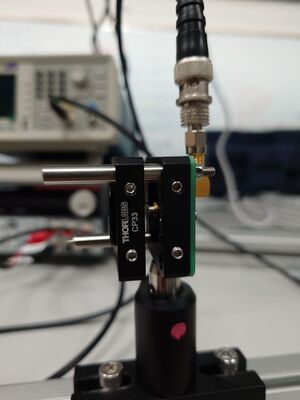
Mount the 650 nm laser diode and use an aspheric lens to collimate and focus the beam onto the reflective target surface.
|
|
| Figure 1. Front view of collimating lens for laser diode | Figure 2. Side view of collimating lens for laser diode |
Detection and Amplification Circuit Configuration
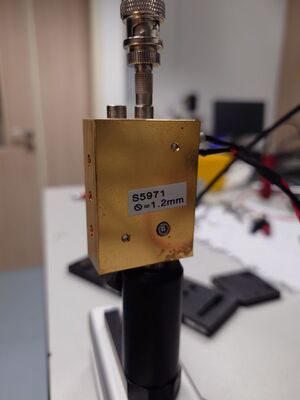
For the photodetector, a Hamamatsu S5971 silicon photodiode was used to detect the reflected light signal. To amplify the signal linearly without saturation, connect the detector output to a matched high-speed preamplifier (bandwidth >100 MHz, gain ∼10³–10⁵). Connect the amplifier output to Channel 2 of a digital oscilloscope; connect the reference signal from the function generator to Channel 1 as the modulation phase reference.
|
| Figure 3. Hamamatsu S5971 silicon photodiode with amplifier |
Time Delay vs. Distance Mapping
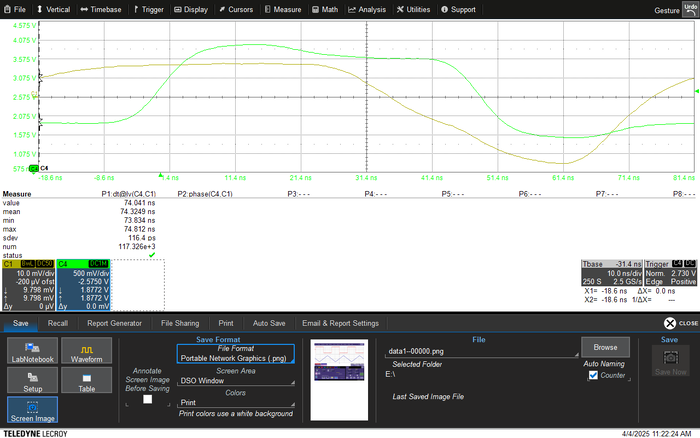
Fix the LED source and the photodetector on a linear translation stage, ensuring proper alignment for the beam return to the detector at all positions along the translation stage; the detector and the laser diode were mounted on a postholder so that the height of the detectors was adjustable. Turn on the LED and ensure that the beam is collimated by adjusting the distance of the lens to the LED. Incident the LED onto the photodetector and observe the function generated on the oscilloscope. Use the oscilloscope’s cursor measurement function to determine the relative time delay Δt between the modulation reference signal (Channel 1) and the return signal (Channel 2). Correlate the measured delay values with corresponding distances to establish the system’s delay–distance response curve. The following are the steps carried out to measure the time delay and the corresponding distance:
- Fix the LED source and the photodetector on a linear translation stage, ensuring proper alignment for the beam return to the detector at all positions along the translation stage; the detector and the laser diode were mounted on a postholder so that the height of the detectors was adjustable.
- Use a meter ruler to mark the distance along the translation stage.
- Move the LED source to the marked positions (e.g. 30 cm from detector) and adjust the beam until it is centralised on the photodetector.
- Measure the time delay on the oscilloscope. Record the minimum, maximum and mean time delay—take three readings per distance and average them.
- Repeat steps 1–4 for different distances on the translation stage.
- Insert a mirror in the setup to act as the “object we are trying to measure the distance of”, so that the beam path is reflected off the mirror to the photodetector.
- Measure the total path length manually and repeat steps 1–4 for each mirror position.
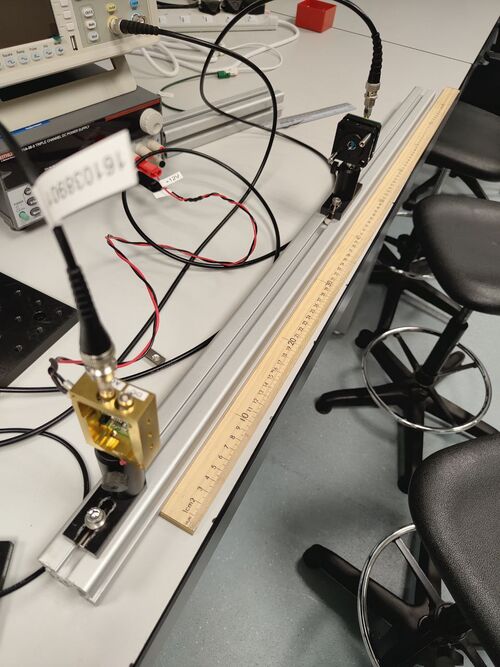
|
| Figure 4. Measurement experimental setup without mirror: LED and photodetector on translation stage. |
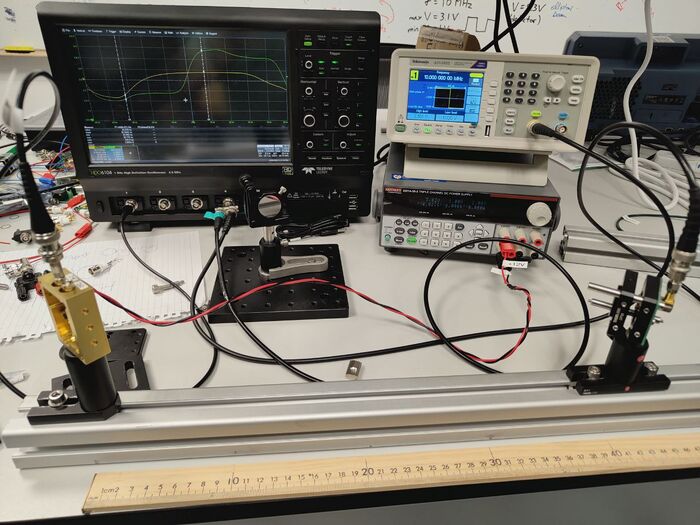
|
| Figure 5. Measurement experimental setup with mirror acting as the “object.” |
Results
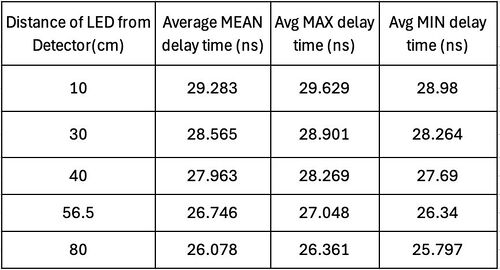
|
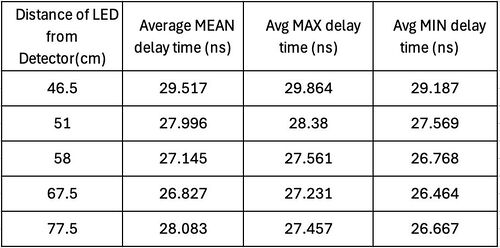
|
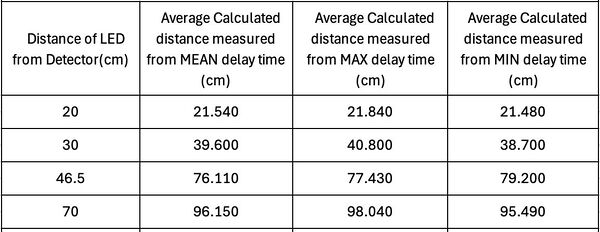
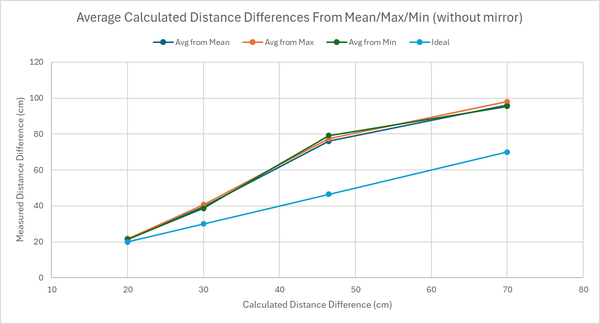
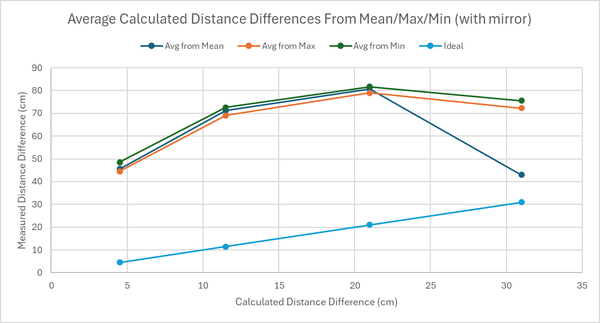
| Table 1. Measured delay time vs manually measured distance between LED and photodetector | Table 2. Measured delay time vs manually measured distance with mirror acting as the “object.” |
The measured delay time is in the order of 20-30 nanoseconds, which, when calculated, gives about 6-9m of distance. However, our incremental changes in the distance between the LED and the photodetector were in the order of 10-80cm. Hence, it was evident that this additional delay time was occurring due to all the cables attached to the oscilloscope and function generation and the distance between the laser and the detector. To account for this, we took the shortest distance as our "reference" distance. The difference between the successive measured distances and the shortest distance gives us the "absolute" distance. We can do this for the measured delay time as well. Take the delay time for the shortest manually measured distance and subtract it from the successive delay times to get an "absolute" delay time. Another method we thought of was simply plotting a linear plot of manually measured distance vs the delay time and obtaining the y-intercept, which would be the additional delay time due to the system and the cables. One could then subtract this additional delay time from the system from each measured delay time. However, when we measured the gradient of this linear plot on multiple days, the gradient was slightly different each time the measurements were carried out. Hence, we decided to adopt the former approach.
Challenges and Conclusion
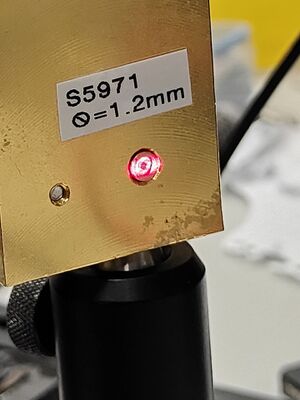
- One of the challenges we faced was centring the beam onto the photodetector. Due to the lack of a focusing beam on the photodetector, the laser beam spot size was much larger than the surface area of the photodetector. What this led to was a constant fluctuation of the delay time on the oscilloscope as the brightest part of the beam was not always centred on the photodetector despite optimising stabilisation of the beam path.
|
| Figure 9. Beam spot on photodetector |
- To have accurate distance measurements in the centimetre regime, the delay time we required was ~0.3ns for every 10cm. However, the fluctuation of the delay time on the oscilloscope was causing the 1st decimal place to fluctuate constantly.
Though the concept of the project was fairly straightforward, the yielded results were not precise within the uncertainty. This points to experimental errors such as the lack of a focusing mirror which caused fluctuations in the delay.
Improvements and Future Work
- Install a focusing lens for the photodetector
- Use a bandpass filter at 650 nm laser to filter out other frequencies to get less fluctuations in the delay time reading on the oscilloscope.
