Humidity Sensor of Graphite: Difference between revisions
| Line 3: | Line 3: | ||
== Background == | == Background == | ||
Humidity sensors are vital in environmental monitoring, industrial control, agriculture, and healthcare. Traditional sensors using metal oxides or polymers often suffer from slow response and low sensitivity. | |||
Carbon-based materials, with their high surface area, conductivity, and chemical stability, offer better performance. CNTs and graphene, for example, improve response speed and signal accuracy. | |||
Humidity sensing mainly relies on the interaction between water molecules and carbon materials, affecting resistance or capacitance. | |||
With continuous material optimization, carbon-based sensors are expected to achieve higher accuracy and adapt to complex humidity environments. | |||
== Literature Review == | == Literature Review == | ||
Revision as of 21:15, 28 April 2025
Team Member
Xu Ruizhe, Ma Shunyu, Li Zerui, Wei Heyi
Background
Humidity sensors are vital in environmental monitoring, industrial control, agriculture, and healthcare. Traditional sensors using metal oxides or polymers often suffer from slow response and low sensitivity. Carbon-based materials, with their high surface area, conductivity, and chemical stability, offer better performance. CNTs and graphene, for example, improve response speed and signal accuracy. Humidity sensing mainly relies on the interaction between water molecules and carbon materials, affecting resistance or capacitance. With continuous material optimization, carbon-based sensors are expected to achieve higher accuracy and adapt to complex humidity environments.
Literature Review
Infrared spectroscopy is an established method for the quantitative analysis of ethanol concentration due to its non-destructive, rapid, and accurate measurement capabilities. The Beer-Lambert law is commonly employed for absorbance-based concentration analysis, linking the absorbance to concentration through known absorption characteristics of molecules, although it is not directly utilized in our approach.
Previous studies have extensively explored the application of FT-IR and FT-NIR spectroscopies for ethanol measurement. Mendes et al. (2003) utilized Fourier transform near-infrared (FT-NIR) and Fourier transform Raman (FT-Raman) spectrometries combined with partial least squares (PLS) regression to determine ethanol content in fuel ethanol and beverages. Their FT-NIR model showed a relative standard error of prediction as low as 0.04%, demonstrating the technique's potential for precise ethanol quantification in complex solutions, such as beverages containing sugars (Mendes et al., 2003). Similarly, Conklin et al. (2014) demonstrated the applicability of FT-IR spectroscopy for ethanol determination in gasoline, leveraging O-H and alkane C-H absorption bands to achieve accurate ethanol measurements. Their calibration methods provided linear, reliable results consistent with actual ethanol content values, emphasizing infrared spectroscopy's robustness for quantitative chemical analysis (Conklin et al., 2014).
Advancements in spectral data analysis have significantly enhanced the accuracy and efficiency of infrared spectroscopy. Zhao and Du (2016) introduced a spectral-spatial feature-based classification (SSFC) framework combining dimension reduction and deep learning. The approach integrated balanced local discriminant embedding (BLDE) for spectral feature extraction and convolutional neural networks (CNN) for spatial feature extraction, significantly outperforming traditional spectral analysis methods in classification accuracy (Zhao & Du, 2016).
Deep learning and machine learning techniques have also emerged prominently in recent spectral feature extraction and classification studies. Wang et al. (2017) proposed a new automated spectral feature extraction method based on deep neural networks, significantly reducing computational costs compared to conventional iterative optimization algorithms. Their method successfully extracted informative and non-redundant spectral features, applicable not only to spectral classification but also defective spectra recovery (Wang et al., 2017).
These studies collectively underline the effectiveness of combining infrared spectroscopy with advanced computational techniques such as PCA and machine learning methods. PCA, particularly, has become an established technique in spectral data analysis due to its capability of reducing dimensionality while preserving significant data variance. Moreover, modern approaches such as CNN and deep learning further enhance spectral analysis by automating feature extraction and improving classification accuracy, providing an effective framework for accurately identifying ethanol concentration in complex solutions.
In short, integrating infrared spectroscopy with sophisticated computational methods offers promising avenues for precise, rapid, and non-contact ethanol concentration measurement, significantly surpassing traditional measurement techniques regarding accuracy, efficiency, and operational convenience.
Principles
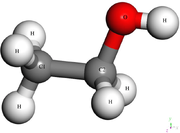
Alcohol molecules exhibit distinct absorption characteristics in the infrared spectrum due to the vibrational modes of specific functional groups, particularly the hydroxyl (-OH) and methyl (-CH₃) groups. These groups interact with infrared light at specific wavelengths, leading to unique absorption peaks that can be utilized for concentration measurement.
In the near-infrared (NIR) region, the wavelength range between 1250 nm and 1350 nm is particularly sensitive to ethanol concentration. Notably, around 1300 nm, ethanol demonstrates significant variations in absorption intensity that correlate directly with its concentration. This is primarily due to the overtone and combination vibrations of the C-H and O-H bonds, which result in measurable absorption differences as ethanol content changes.
By analyzing these absorption variations, it is possible to accurately determine alcohol concentration in a given sample. The wavelength of 1300 nm is chosen as the optimal measurement wavelength because it provides a clear and distinguishable response to ethanol concentration changes.
Objective
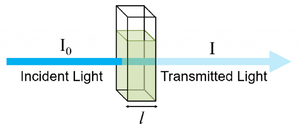
This experiment proposes a non-contact alcohol concentration measurement method by using infrared spectroscopy. This method measures changes in infrared light intensity transmitted through alcohol solutions, using a spectrometer and principal component analysis to achieve high precision measurements.
Advantages of Infrared-Based Alcohol Detection
- Non-contact measurement, reducing contamination.
- High accuracy, based on alcohol-specific infrared absorption characteristics.
- Low cost, with simple photodetection devices.
Equipment Required
- Different concentration of ethanol
- Cuvette
- LAMBDA 850 Spectrometer
Experiment Set Up
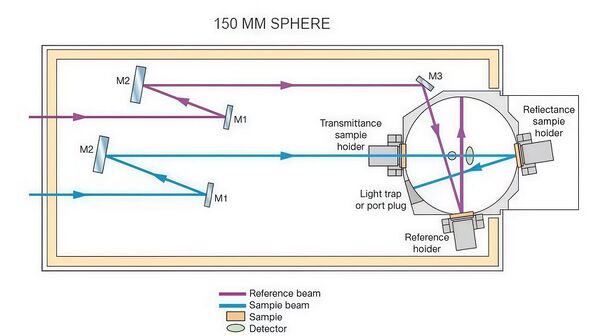
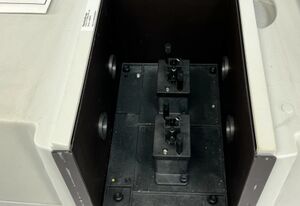
The LAMBDA 850+ UV-Visible-NIR spectrophotometer used for measurements is capable of precise spectral measurements within the wavelength range of 800 nm to 1400 nm, making it suitable for analyzing the absorption characteristics of substances such as alcohol molecules. The device is equipped with both a deuterium lamp and a tungsten-halogen lamp, providing UV and visible/near-infrared light sources, respectively. The high-quality master-engraved holographic grating monochromator ensures precise wavelength control, guaranteeing high-resolution spectral measurements.
The core of the device includes a high-sensitivity R6872 photomultiplier tube (PMT) detector, ensuring accurate signal collection across a broad wavelength range from UV to near-infrared. In the analysis of the effect of alcohol concentration changes on absorption intensity, the LAMBDA 850+ provides high sensitivity and precise measurements.
With this high sensitivity and precision configuration, it provides strong support for the optical property analysis of solutions such as alcohol, especially excelling in peak absorption location and concentration variation analysis.
Experiment Procedures
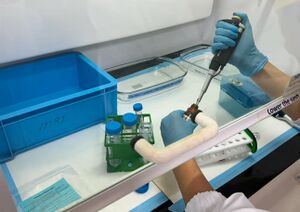
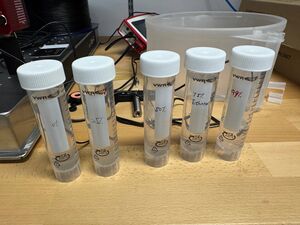
- Preparation of alcohol solutions at concentrations of 25%, 50% and 75%.
- Measurement of absorption using spectrometer.
- Use Origin software for spectral normalization and baseline correction, and process the alcohol spectra at three different concentrations.(Due to the subtle differences in the spectral data, it is difficult for non-experts to visually distinguish between the spectra of the three alcohol concentrations. Therefore, machine learning-based Principal Component Analysis (PCA) is applied for spectral classification, enabling accurate measurement of alcohol concentration.)