Humidity Sensor of Graphite: Difference between revisions
| Line 96: | Line 96: | ||
We used an Arduino board to connect the circuit and sensors, receiving digital signals through Arduino software. Python was used to extract and process the signals in real time, simulating the output voltage of the test sample and reading the actual humidity from the reference sensor (DHT11). | We used an Arduino board to connect the circuit and sensors, receiving digital signals through Arduino software. Python was used to extract and process the signals in real time, simulating the output voltage of the test sample and reading the actual humidity from the reference sensor (DHT11). | ||
We also use the Arduino as the power supply for resistance measurement circuit. R_0 | We also use the Arduino as the power supply for resistance measurement circuit. R0 is the standard resistance. R1 is our sensor. The total voltage Arduino provides is 5V. The resistance of sensor can be calculated by; | ||
<center><math>R_1 = \frac{V}{5-V} \times R_0</math></center> | |||
== Objective == | == Objective == | ||
Revision as of 05:14, 29 April 2025
Team Member
Xu Ruizhe, Ma Shunyu, Li Zerui, Wei Heyi
Introduction
Humidity sensors play an essential role in fields such as environmental monitoring, industrial process control, agriculture, and healthcare, where accurate humidity measurements are critical. High-quality sensors are necessary to precisely track humidity levels and variations. Traditionally, materials like metal oxides and polymers have been used, but they often suffer from limitations including slow response times, low sensitivity, and limited accuracy.
In recent years, carbon-based materials have gained significant interest due to their unique physical and chemical properties. They offer remarkable features such as high surface area, excellent electrical conductivity, and strong chemical stability across various environments. These advantages make carbon materials highly promising for developing sensitive and reliable humidity sensors. For instance, carbon nanotubes (CNTs) enhance sensor response speed thanks to their large surface area and porosity, while graphene provides ultra-fast signal transduction owing to its thin structure and superior conductivity. Other forms like carbon black and carbon fiber show strong resistance to humidity-induced degradation, ensuring long-term operational stability.
The humidity sensing capability of carbon-based materials largely stems from their interaction with water molecules. Changes in humidity cause adsorption or desorption of water on the material surface, altering properties such as resistance or capacitance. Sensor performance can further be tailored by adjusting material morphology or engineering defects.
In conclusion, carbon-based materials offer exciting prospects for future humidity sensing technologies. By continuously improving their physicochemical properties through nanotechnology and materials engineering, it is possible to develop sensors with greater sensitivity, faster response, and broader adaptability to complex humidity environments.
Experimental Principle
In this experiment, a layer of graphite was coated onto paper-based substrates. The fiber paper is primarily composed of cellulose, consisting of long chains of glucose units containing hydroxyl (-OH) groups capable of attracting water molecules. When humidity increases, the hydroxyl groups form hydrogen bonds with water molecules, allowing cellulose to absorb moisture. This adsorption process causes the cellulose structure to expand, affecting the spacing and contact points between graphite particles on the surface.
The graphite layer on the paper was applied using a pencil and plays a crucial role in the humidity response of the sensor based on resistance changes. Graphite, composed of layers of carbon atoms and localized electrons, exhibits excellent electrical conductivity. In the resistive humidity sensor, the adsorption of water molecules modifies the graphite network because the adsorbed water molecules alter the connectivity between graphite particles.
Under low humidity conditions, electrical conduction mainly occurs through direct contact between graphite particles, and the sensor exhibits an intrinsic resistance . As humidity rises, a thin layer of water molecules adsorbs onto the surface, initially forming a monolayer. During this monolayer adsorption, water molecules ionize according to:
The generation of and ions facilitates charge transport, enhancing the conductivity and thus decreasing the resistance according to:
where is the effective length and is the cross-sectional area through which conduction occurs.
As humidity further increases, multilayer adsorption takes place, increasing the thickness of the adsorbed water film. This thick water layer impacts the conductivity in two competing ways: on one hand, the increased number of ions continues to promote conducticonduction and decrease resistance; on the other hand, when the water layer becomes thick enough, it can act as an insulating barrier, interrupting direct electrical pathways between graphite particles and causing the resistance to rise. Thus, due to this competition, the sensor’s resistance exhibits a non-monotonic trend with increasing humidity—initially decreasing and subsequently increasing as the humidity surpasses a certain point.
Additionally, the porous structure of the paper significantly influences the sensor's response. Tiny voids within the cellulose fibers can trap water molecules, leading to localized moisture accumulation. This trapped moisture can either enhance ionic conductivity or disrupt the graphite network, depending on the amount and distribution of absorbed water. Consequently, microscopic changes in water content cause corresponding variations in the effective resistance of the sensor. However, because the evaporation of water trapped within micropores is relatively slow, the recovery time of the sensor may be prolonged after humidity levels drop.
Objective
(1) Build a a sealed drying chamber: use a dry box; control the humidity by desiccants and hot water.
(2) Monitor the humidity with sensor: use DHT11 sensor to monitor the humidity and temperature inside the chamber; verify the range of humidity.
(3) Measure the resistance of Graphite sensor: use Arduino to measure the resistance; record the data with Python code.
(4) Data analysis: use Python code to do fitting; get the experimental relationship between Graphite's resistance and humidity; analyze the error.
Equipment Required
DHT11
The DHT11 is a temperature and humidity composite sensor with calibrated digital signal output, suitable for measuring ambient temperature and humidity. It can be coded with Arduino. Here we use this sensor to get the standard humidity.
Basic Specifications
| Parameter | Value |
|---|---|
| Temperature Range | 0 – 50°C |
| Temperature Accuracy | ±2°C |
| Humidity Range | 20 – 90% RH |
| Humidity Accuracy | ±5% RH |
| Sampling Period | ≥ 1 second |
| Signal Output | Digital (single-wire) |
Dry box and Desiccant
A dry box is a sealed container or cabinet designed to maintain a low-humidity environment to protect sensitive items from moisture. It often uses desiccants, electronic dehumidifiers, or nitrogen purging systems to control humidity levels. Dry boxes are commonly used for storing electronics, photographic equipment, laboratory samples, and moisture-sensitive materials to prevent damage such as corrosion, mold growth, or degradation.
A desiccant is a material that absorbs moisture from its surroundings to maintain dryness and prevent damage caused by humidity. Common types include silica gel, calcium chloride, molecular sieves, and activated alumina, each suited for different humidity control needs. They typically work through physical adsorption or chemical reactions to capture water molecules from the air.
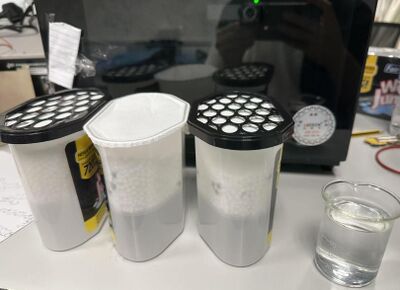
The humidity in the lab is about 60%. The original drying function of dry box can only decrease it to 53% for one hour. We use the dry box as a sealed container to reduce humidity more quickly through the desiccant(about 40% in 15 mins). The humidity rising process is controlled by the hot water vapor.
Arduino
Arduino is an open-source electronics platform based on easy-to-use hardware and software. It consists of microcontroller boards that can read inputs. In this project, we connect it with DHT11 sensor to read the outputs. Arduino also provides 5V output, we use this as the voltage output of a resistor circuit.
Equipment Steps
Humidity Controlling System
To provide a controlled and stable humidity environment for testing experimental samples, we designed a sealed drying chamber. Desiccants were placed inside the chamber to absorb moisture from the air and maintain a low-humidity state. After the humidity is stable, we place a cup of hot water inside the dry box to raise the humidity.
Fabrication of Graphite Humidity Sensor
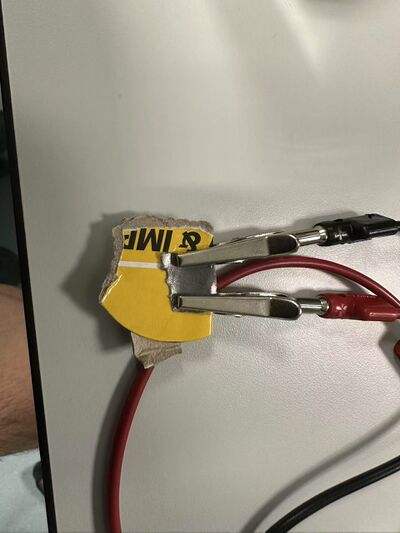
We selected the pencil as the source of graphite and applied it across the entire surface of a rectangle paper through coating. Try to keep the graphite layer flat during this process The paper is adhered to a cardboard substrate, which provided stable support to prevent deformation to the paper during testing. We clamp both ends of the paper with clips and connect the sensor to the external circuit
Measurement System
We used an Arduino board to connect the circuit and sensors, receiving digital signals through Arduino software. Python was used to extract and process the signals in real time, simulating the output voltage of the test sample and reading the actual humidity from the reference sensor (DHT11).
We also use the Arduino as the power supply for resistance measurement circuit. R0 is the standard resistance. R1 is our sensor. The total voltage Arduino provides is 5V. The resistance of sensor can be calculated by;
Objective
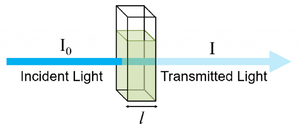
This experiment proposes a non-contact alcohol concentration measurement method by using infrared spectroscopy. This method measures changes in infrared light intensity transmitted through alcohol solutions, using a spectrometer and principal component analysis to achieve high precision measurements.
Advantages of Infrared-Based Alcohol Detection
- Non-contact measurement, reducing contamination.
- High accuracy, based on alcohol-specific infrared absorption characteristics.
- Low cost, with simple photodetection devices.
Equipment Required
- Different concentration of ethanol
- Cuvette
- LAMBDA 850 Spectrometer
Experiment Set Up
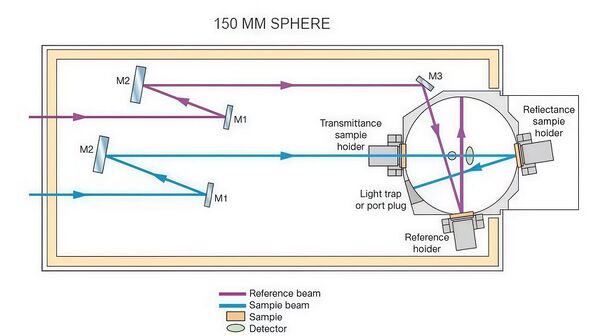
The LAMBDA 850+ UV-Visible-NIR spectrophotometer used for measurements is capable of precise spectral measurements within the wavelength range of 800 nm to 1400 nm, making it suitable for analyzing the absorption characteristics of substances such as alcohol molecules. The device is equipped with both a deuterium lamp and a tungsten-halogen lamp, providing UV and visible/near-infrared light sources, respectively. The high-quality master-engraved holographic grating monochromator ensures precise wavelength control, guaranteeing high-resolution spectral measurements.
The core of the device includes a high-sensitivity R6872 photomultiplier tube (PMT) detector, ensuring accurate signal collection across a broad wavelength range from UV to near-infrared. In the analysis of the effect of alcohol concentration changes on absorption intensity, the LAMBDA 850+ provides high sensitivity and precise measurements.
With this high sensitivity and precision configuration, it provides strong support for the optical property analysis of solutions such as alcohol, especially excelling in peak absorption location and concentration variation analysis.
Experiment Procedures
- Preparation of alcohol solutions at concentrations of 25%, 50% and 75%.
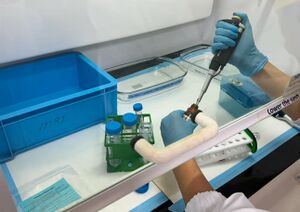
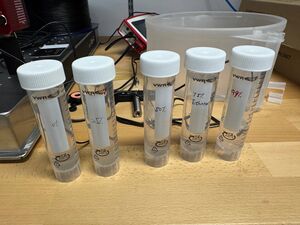
- Measurement of absorption using spectrometer.
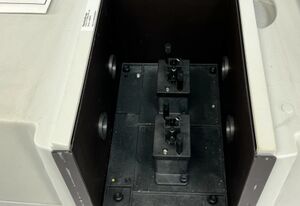
- Use Origin software for spectral normalization and baseline correction, and process the alcohol spectra at three different concentrations.(Due to the subtle differences in the spectral data, it is difficult for non-experts to visually distinguish between the spectra of the three alcohol concentrations. Therefore, machine learning-based Principal Component Analysis (PCA) is applied for spectral classification, enabling accurate measurement of alcohol concentration.)