Ultrasonic Acoustic Remote Sensing: Difference between revisions
| Line 72: | Line 72: | ||
(Image credits: https://commons.wikimedia.org/wiki/File:Animal_echolocation.svg) | (Image credits: https://commons.wikimedia.org/wiki/File:Animal_echolocation.svg) | ||
As mentioned in the trivia, the theory behind ultrasonic remote sensing on the most fundamental level lies in TOF measurements of the time it takes for the sound waves to be reflected off the surface of the object back to the transceiver. For transceivers, the distance is | As mentioned in the trivia, the theory behind ultrasonic remote sensing on the most fundamental level lies in TOF measurements of the time it takes for the sound waves to be reflected off the surface of the object back to the transceiver. For transceivers, the distance is given by the relation: | ||
<math>D = {\frac{1}{2}}{V_{sound}}*\Tau_{TOF}</math> | <math>D = {\frac{1}{2}}{V_{sound}}*\Tau_{TOF}</math> | ||
Where <math>\Tau_{TOF}</math> is the TOF, <math>V_{sound}</math> is the speed of sound. | |||
There is not much more to say other than | It is possible to measure the distances on the small scale by observing changes in the phase of the reflected wave with respect to the transmitted wave. For two transducers face to face, the change in distance is given by the relation: | ||
<math>D = {{\frac{V_{sound}\Delta\Phi}{360f_{sound}}}}</math> | |||
Where <math>\Delta\Phi</math> is the phase difference, <math>f_{sound}</math> is the frequency of sound. | |||
[[File:RM_Diffraction.png|200px|frameless|center|Simple simulation of diffraction pattern if it were to be cast on a screen for various distances.]] | |||
There is not much more to say other than that sound tends to diffract significantly so it is not very directional/has A large measuring Angle which may limit its use. In medical ultrasound, frequencies on the order of megahertz is used to reduce this problem. | |||
https://en.wikipedia.org/wiki/Medical_ultrasound | |||
== Distance & Measurement Angle Measurement HC-SR04 (Experiment 1) == | == Distance & Measurement Angle Measurement HC-SR04 (Experiment 1) == | ||
Revision as of 19:08, 29 April 2025
Acoustic Sensing: Background & Trivia
Chua Rui Ming A0155387U
Sound waves can be used to sense the environment. This technique has been developed in nature and in our technology.
In Nature
This technique is broadly coined by the term "Echolocation" to describe its variants in different species. Some examples:
- Bats
- Bats echolocate with a frequency of 11-212kHz with most operating between 20-60kHz (Jones & Holderied, 2007).
- Cetaceans (Whales & Dolphins)
- Chong et. al. (2021) performed an experiment to test the ability of dolphins to decipher objects of various materials (but otherwise identical) with their biosonar. In their experiment, their bottlenose dolphin, Ginsan, produced frequencies in the range of 50kHz-130kHz.
- Shews
- Shrews echolocate with a frequency of 30-60kHz (Thomas & Jalili, 2004). According to Chai et. al (2020), genome data suggests that bats, cetaceans and shews experience convergent evolution, sharing the same set of genes for this skill.
In Technology
This technique is employed by different types of technology, for example in SONAR or in Seismic Inversion.
- SONAR
- SONAR is used primarily in underwater related work. Aside from military uses popularized in popular culture, SONAR is used for the study of shipwrecks (Deep Sea Archaelogy). They employ frequencies of up to 600kHz for high resolution sensing or down to 1kHz for deep sensing (Soreide, 2011).
- Seismic Inversion
- Seismic Inversion refers to the use of sound to extract layers of the earth. This is used by geophysicists in environmental remote sensing to understand the rock composition of the region for general purposes or to locate minerals or oil and gas (Chen et. al, 2017). The source of the sound could be actively caused via explosives or passively recorded via external sources such as traffic noise (Dou et. al, 2017). The frequency of such waves can be as low as 0.6-37Hz (Dou et. al, 2017).
Principles
The most basic principle behind this technique rely on round trip Time-Of-Flight (TOF) measurements of reflected sound waves. However, more complicated principles can be involved. For example:
- In Seismic Inversion (oversimplified), one considers a delayed response composed of multiple reflections of waves propagating through a geologic medium to reconstruct structural layers.
- In Echolocation, bats use Doppler Shifts while hunting to locate moving targets.
Project Overview
In this project, we will use sound to sense the environment. From the previous section, it is clear that the use of sound in remote sensing can be quite varied with different techniques from up to 600kHz down to 0.6Hz. Therefore, we should start by defining the scope of the project.
Scope
In this project, we will use sound in the ultrasonic range (>20kHz) for remote sensing.
- Ultrasonic sound operates beyond the range of human hearing which is ideal for non-intrusive remote sensing.
- Ultrasonic sound, with its shorter wavelength, is more directional. This improves the resolution of our sensing.
We will utilize ultrasonic transducers/sensors on the 30kHz-50kHz range due to the availability of the components.
We will focus on simple Time-of-Flight measurements for remote sensing for now. If possible, we will explore other techniques for remote sensing.
Objectives
- Can we emit & detect ultrasonic sound waves with a pair of transducer-receiver (transceiver) to make Time-of-Flight measurements?
- If so, quantify the performance of the device.
- Can we get it to work with difference transducers?
- Can we go beyond simple TOF measurements?
Tools
On the most basic level to run our experiment, we require a source of ultrasonic sound, a receiver sensitive to ultrasonic wavelengths, and a board to control these devices in a manner suitable for remote sensing measurements. Arduino provides a convenient solution for these requirements. On top of that, we have individual transceivers, function generators, oscilloscopes and amplifiers to build our own device with raw data to process.
- Arduino UNO R3
- HC-SR04 Ultrasonic Transceiver
- MCUST16A40S12RO Transducer
- MCUSD14A48S09RS-30C Transducer
- Peak Tech 160MHz Function/Arbitrary Waveform Generator 4046
- Stanford Research Systems Model SR560 Low-Noise Preamplifier
- Keysight InfiniiVision MSOX2004A Mixed Signal Oscilloscope 70MHz
At the conclusion of this project we:
- Performed preliminary measurements of distance on the HC-SR04
- Verified distance measurements via TOF measurements with the MCUST16A40S12RO with two different methods
- Verified fine-grained distance measurements via phase measurements with the MCUSD14A48S09RS-30C
Theory
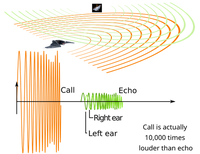
(Image credits: https://commons.wikimedia.org/wiki/File:Animal_echolocation.svg)
As mentioned in the trivia, the theory behind ultrasonic remote sensing on the most fundamental level lies in TOF measurements of the time it takes for the sound waves to be reflected off the surface of the object back to the transceiver. For transceivers, the distance is given by the relation:
Where is the TOF, is the speed of sound.
It is possible to measure the distances on the small scale by observing changes in the phase of the reflected wave with respect to the transmitted wave. For two transducers face to face, the change in distance is given by the relation:
Where is the phase difference, is the frequency of sound.
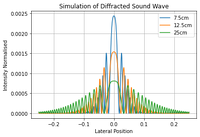
There is not much more to say other than that sound tends to diffract significantly so it is not very directional/has A large measuring Angle which may limit its use. In medical ultrasound, frequencies on the order of megahertz is used to reduce this problem.
https://en.wikipedia.org/wiki/Medical_ultrasound
Distance & Measurement Angle Measurement HC-SR04 (Experiment 1)
We start with the HC-SR04.
Set-up

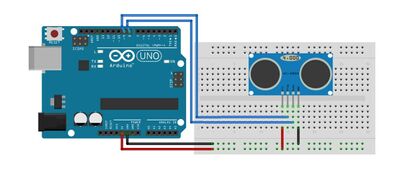
We connected the HC-SR04, which serves as the source and receiver, to the Arduino UNO R3 based on the above described circuit. From left to right of the HC-SR04: VCC-5V, Echo-pin 10, Trigger-pin 9, Ground-Ground. This completes the hardware of the set-up.
The software to programme the Arduino to readout the distance is readily available online with little to no minor modifications (Pendergast, 2021). Following which, the programme "CoolTerm" was used to write the readout information into a text file for further processing on Python (Meier, n.d.).
Method
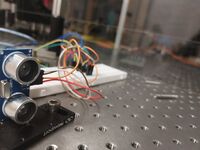
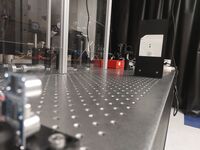
We conducted our experiment on an optical table.
- The transceiver was mounted onto the optical table.
- A magnetic beam height ruler was used as the object for the transceiver to measure its distance from the transceiver.
- Measurements were made for different known distances of the ruler from the transceiver by positioning the ruler based on the mounting hole spacing of the optical table.
- 5kB of measurement data was collected for each measurement in order to obtain sufficient statistics (200 measurements).
Results
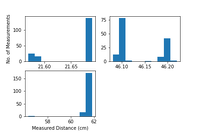
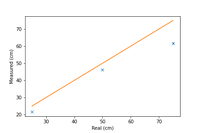
On the first try, distance measurements were made for 3 straight line distances 10, 20, & 30 spaces from the transceiver corresponding to 25cm, 50cm, 75cm from the transceiver.
- 25cm: 21.849 +- 0.046cm
- 50cm: 46.537 +- 0.049cm
- 75cm: 62.163 +- 0.45cm
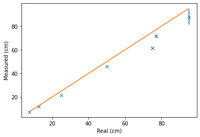
Measurement statistics indicate that the HC-SR04 offers great precision in measurement. However, there seems to be a small systematic offset in the measured distance from the true distance which could be correctable by some calibration while the larger inaccuracy of the 3rd measurement can be explained by the presence of other obstacles on the optical table, in this case, the acrylic board in the background which could cause the sound waves to be prematurely reflected back into the board due to the high divergence of the sound wave. This is because the HC-SR04 works by sending 8 40KHz ultrasound pulses when the trigger pin is set to HIGH. Following which, the echo pin is set to HIGH until receiving the first instance of the echo, indiscriminately (Elecfreaks, n.d.). To test this hypothesis, and to draw a better conclusion on the performance of the HC-SR04, we repeated the measurements for more data on a different, empty, optical table.
Cumulatively:
- 7.5cm: 7.484 +- 0.051cm
- 12.5cm: 11.877 +- 0.052cm
- 25cm: 21.849 +- 0.046cm
- 50cm: 46.537 +- 0.049cm
- 75cm: 62.163 +- 0.45cm
- 77cm: 71.6 +- 1.3cm
- 95cm: 87.8 +- 6.4cm
The results of the second measurement supported the hypothesis since subsequent measurements further from the 75cm mark (in green) were much closer to the true value. However, the measured distance does indeed become increasingly inaccurate and imprecise with increasingly distance.
In terms of directionality of the HC-SR04:
- This underscores the limitation of ultrasonic sensors in pin-point distance measurements in the presence of multiple obstacles.
- However, they function as excellent nearest-object proximity sensors useful in applications such as parking sensors.
Distance Measurement Based on Time-Of-Flight Technique (MCUST16A40S12RO) (Experiment 2)
Set-Up
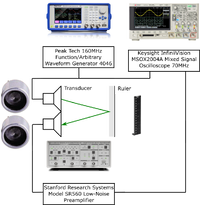
The set-up is as follows:
- Two transducers were placed side by side similar to the HC-SR04. One transducer will emit the sound which will be reflected off a magnetic beam height ruler before being detected by the other transducer. The traversed distance is thus roughly two times that of the physical distance between the transducers and the ruler.
- We connected the Arbitrary Waveform Generator to a BNC T adapter which is in turn connected to the oscilloscope and the first transducer (transmitter).
- The Arbitrary Waveform Generator was set to send 8 pulses of 40KHz sine wave
- The signal to the oscilloscope becomes the trigger for the TOF measurement
- The signal to the first transducer generates the sound wave
- We connected the second transducer (receiver) to the Low-Noise Preamplifier to amplify the received signal before transmission to the oscilloscope.
- We set the amplification factor to 10x
- We set a high pass filter of 10kHz to filter out unwanted noise
- We set a low pass filter of 100kHz to filter out unwanted noise
- We connected the Low-Noise Preamplifier to the oscilloscope
- The signal to the oscilloscope is the echo from the reflected sound wave.
Method
- The time difference between the trigger & echo waves serve is proportional to, but not directly translated into, the TOF result for distance measurement
- This is because there is a non-negligible offset required for the transducer to emit and receive the waves
- Moreover, there is the difficulty of defining the start-end points of the TOF measurement or the point of trigger & echo, particularly when the pulses are not sharply defined in time
The first problem can be solved by calibrating the instrument via multiple measurements over known distances. The result should be linear where the Y intercept corresponds to the offset while the (gradient)^-1 corresponds to the speed of sound in air (343m/s).
To solve the second problem, two different methods were conceived:
- In the first method, we fix the definition of the point of trigger and the point of echo.
- The point of trigger is defined as the point in time where the voltage crosses 1/10th the peak value of the first of eight pulses
- The point of echo is defined as the point in time where the voltage crosses 1/5th the peak value of the received signal
- In the second method, we perform a cross correlation of the trigger and echo signals.
- The location of the peak of the cross correlation measurement, where the two signals most overlap, corresponds to the time difference
- The experiment was conducted on an optical breadboard. Measurements were taken in steps of 2.5cm using the breadboard spacing.
Results


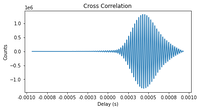
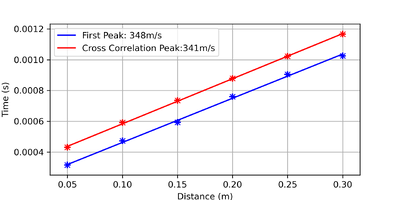
The thumbnails on the left feature the oscilloscope trace of the 5cm, 10cm, 20cm, & 30cm measurements, one cross correlation measurement of the 5cm measurement, and the data collectively summarized in the graph. It is clear from the images that there is an increase in the TOF of the pulses with increasing travel distance. Furthermore, it is also clear that the signal from the reflected sound wave does not feature the same waveform as the trigger signal; The piezotransducers continues to oscillate beyond the 8 pulses, leading to the second problem described. By employing the two methods described in the previous section, we obtain the following results:
- Method 1: Direct measurement of TOF by defining fixed trigger & echo
- 5cm: 0.000316 +- 0.000035s
- 10cm: 0.000473 +- 0.000035s
- 15cm: 0.000593 +- 0.000035s
- 20cm: 0.000759 +- 0.000035s
- 25cm: 0.000905 +- 0.000035s
- 30cm: 0.001026 +- 0.000035s
This results in a gradient of 0.00287221 +- 3.7e-09 which implies a speed of sound of 348.16451 +- 0.00045m/s.
- Method 2: Extrapolation of TOF from cross correlation peak
- 5cm: 0.000431 +- 0.000035s
- 10cm: 0.000591 +- 0.000035s
- 15cm: 0.000735 +- 0.000035s
- 20cm: 0.000878 +- 0.000035s
- 25cm: 0.001023 +- 0.000035s
- 30cm: 0.001167 +- 0.000035s
This results in a gradient of 0.00293137 +- 8.5e-10 which implies a speed of sound of 341.13752 +- 0.00010m/s.
It is clear that both method gave excellent estimates of the speed of sound. The second method provided a slightly better estimate, but both methods should suffice for distance measurements once calibrated.
Distance Measurement Based on Phase Change Technique (MCUSD14A48S09RS-30C) (Experiment 3)
In the third experiment we consider an ultrasonic remote sensing technique in the presence of minute changes in distance. This can be used, for example, in sensing the surface roughness of what should be flat surfaces.
Set-up
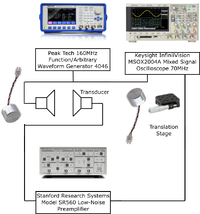
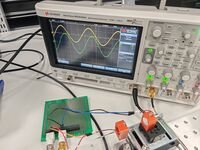
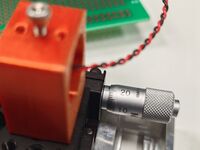
The set-up is not much different to the set-up of experiment 2. Some minor modifications will be highlighted:
- We connected the Arbitrary Waveform Generator to a BNC T adapter which is in turn connected to the oscilloscope and the first transducer (transmitter).
- The Arbitrary Waveform Generator was set to send a CW train of 48KHz sine wave
- The signal to the oscilloscope becomes the trigger for the TOF measurement
- Both transducers were mounted onto a 3D printed holder
- The first transducer was mounted onto an acrylic board previously designed to make the distance measurement device. The board was in turn mounted onto an optical breadboard
- The second transducer was mounted onto a translation stage with a micrometer scale. The translation stage was also mounted onto the same optical breadboard
- Both transducers now have a fixed position which can be varied on the micrometer scale
- The signal to the first transducer generates the sound wave
- We connected the second transducer (receiver) to the Low-Noise Preamplifier to amplify the received signal before transmission to the oscilloscope.
- We set the amplification factor to 10x
- We set a high pass filter of 10kHz to filter out unwanted noise
- We set a low pass filter of 100kHz to filter out unwanted noise
- We connected the Low-Noise Preamplifier to the oscilloscope
- The signal to the oscilloscope is the echo from the reflected sound wave.
Method
- In the case of stationary objects, the transmitted and reflected sound waves would oscillate with the same frequency
- However, due to time differences, the two waves would differ by a phase
- In the presence of minute changes in the traversed distance, for example due to surface roughness, there will be minute changes to time differences which is more easily picked up by the difference in phase than the difference in TOF
- For example, with the MCUSD14A48S09RS-30C, each degree would represent changes in distance of 1.97*10^-5m, offering great precision
- By comparison, the same level of precision would require observing a TOF difference of 5.787037037037037e-08s
- To determine the phase difference, we measured the phase difference on the oscilloscope when the two transducers were placed roughly 5cm from each other
- The phase difference was measured in 30 instances in order to gather sufficient statistics
- Sets of measurements were taken in steps of 10^-5m using the translation stage
- Once multiple sets of measurements were taken the device can be calibrated to make fine-grained distance measurements
Results


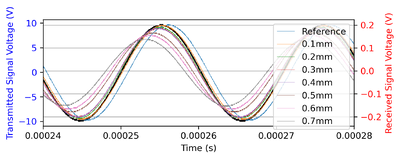
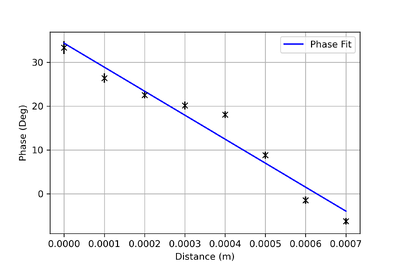
The thumbnails on the left feature the oscilloscope trace of some of the measurements. We obtained the following results:
- Reference position: 33.364117647058826 +- 1.5deg
- 10^-5m: 26.4 +- 1.1deg
- 20^-5m: 22.6 +- 0.76deg
- 30^-5m: 20.14 +- 0.91deg
- 40^-5m: 18.09 +- 0.76deg
- 50^-5m: 8.797586206896552 +-0.77deg
- 60^-5m: -1.4765625 +- 0.84deg
- 70^-5m: -6.293333333333334 +- 0.74deg
The results were presented collectively with a gradient of -5.48138017e+04 +- 0.86e+04 which implies a speed of sound of 320+-49m/s. Once calibrated, this method can serve as a viable solution to fine-grained distance measurement. However, the propagation distance between the transducers should be small.
Code Written for the Experiments
import math import matplotlib.pyplot as plt import numpy as np from numpy import nan import pandas as pd from scipy.optimize import curve_fit from scipy import signal
def Process_Data(df):
   #read csv file
   df = pd.read_csv(df,names = colnames)
   df = df.iloc[2:]
   X = np.asarray(df["A"],dtype=np.float64)
   Y = np.asarray(df["B"],dtype=np.float64)
   Y2 = np.asarray(df["C"],dtype=np.float64)
   L = []
   L2 = []
   #remove nan values in data. keep uncorrupted data
   for i in Y:
       if np.isnan(i) == False:
           L.append(i)
   for i in Y2:
       if np.isnan(i) == False:
           L2.append(i)
   #find the mean to center y values about 0
   Mean_Y = sum(L)/len(L)
   Mean_Y2 = sum(L2)/len(L2)
   Y = (Y-Mean_Y)
   Y2 = (Y2-Mean_Y2)
   #find channel corresponding to original sound wave
   #works by finding set of data with larger value since original sound wave will have higher value
   #original sound wave will happen first
   #set start of original sound wave to T = 0
   if max(L-Mean_Y) > max(L2-Mean_Y2):
       Start = np.nanargmax(Y>max(Y)/10)
       Start1 = np.nanargmax(Y>max(Y)/10)
       while math.isnan(Y[Start1]) == True:
           Start1 = Start1+1
       Start2 = np.nanargmax(Y[Start1:]>max(Y[Start1:])/10)
       Start = Start + Start2
       X = X[Start:]
       X = X - X[0]
       Y = Y[Start:]
       Y2 = Y2[Start:]
   else:
       Start = np.nanargmax(Y2>max(Y2)/10)
       Start1 = np.nanargmax(Y2>max(Y2)/10)
       while math.isnan(Y2[Start1]) == True:
           Start1 = Start1+1
       Start2 = np.nanargmax(Y2[Start1:]>max(Y2[Start1:])/10)
       Start = Start + Start2
       X = X[Start:]
       X = X - X[0]
       Y = Y[Start:]
       Y2 = Y2[Start:]
   return X, (Y), (Y2)
def Find_Delay(X, Received_Signal):
   #find start of received signal
   Reflected = np.nanargmax(Received_Signal>max(Received_Signal)/5)
   #find delay
   Delay = X[Reflected] - X[0]
   return Delay
def Cross_Correlation(X,Y,Y2):
   NX3 = []
   X3 = []
   Y3 = []
   Y23 = []
   for i in range(len(X)):
       if math.isnan(Y2[i]) == False:
           NX3.append(-1*X[i])
           X3.append(X[i])
           Y3.append(Y[i])
           Y23.append(Y2[i])
       else:
           continue
   Correlation = signal.correlate(Y3, Y23, mode = 'full')
   NX3 = NX3[::-1]
   X4 = NX3+X3[1:]
   return X4, Correlation
def Find_Delay_CC(X, Received_Signal):
   #find start of received signal
   Reflected = np.nanargmax(Received_Signal==max(Received_Signal))
   Delay = X[Reflected]
   return Delay
def Diffraction_Pattern(Frequency, Speed_Of_Sound, Length_Distance, Slit_Width, Wall_Size):
   F = Frequency
   S = Speed_Of_Sound
   D = Length_Distance
   Position_Along_Slit = np.arange(-Slit_Width/2,Slit_Width/2,0.0001)
   Position_Along_Wall = np.arange(-Wall_Size/2,Wall_Size/2,0.0001)
   Wavelength = Frequency_2_Wavelength(F, S)
   print(Wavelength)
   Pattern = []
   for i in Position_Along_Wall:
       Phases = []
       Intensities = []
       for j in Position_Along_Slit:
           Reference_Phase = Phase(Distance(D, 0, 0),Wavelength)
           L = Distance(D, j, i)
           P = Phase(L,Wavelength)
           Phases.append(Reference_Phase-P)
           Intensities.append(np.cos(Reference_Phase-P))
       Pattern.append(((sum(Intensities)/len(Intensities))**2)/len(Intensities))
   Pattern = Pattern/sum(Pattern)
   plt.plot(Position_Along_Wall, Pattern)
   return Pattern, Position_Along_Wall
References
Jones, G., & Holderied, M. W. (2007). Bat echolocation calls: adaptation and convergent evolution. Proceedings. Biological sciences, 274(1612), 905–912. https://doi.org/10.1098/rspb.2006.0200
Wei, C., Hoffmann-Kuhnt, M., Au, W.W.L. et al. (2021). Possible limitations of dolphin echolocation: a simulation study based on a cross-modal matching experiment. Sci Rep 11, 6689. https://doi.org/10.1038/s41598-021-85063-2
Thomas, J. A., Moss, C., & Vater, M. (2004). Review of echolocation in insectivores and rodents. In Echolocation in bats and Dolphins. essay, University of Chicago Press. https://www.researchgate.net/publication/258835904_Review_of_echolocation_in_insectivores_and_rodents
Chai, S., Tian, R., Rong, X., Li, G., Chen, B., Ren, W., Xu, S. & Yang, G. (2020). Evidence of Echolocation in the Common Shrew from Molecular Convergence with Other Echolocating Mammals. Zoological Studies 59: 4. https://doi:10.6620/ZS.2020.59-4
Chen, Y., Chen, H., Xiang, Kui., Chen, X. (2017). "Geological structure guided well log interpolation for high-fidelity full waveform inversion". Geophysical Journal International. 209 (1): 21–31. doi:10.1093/gji/ggw343
Dou, S., Lindsey, N., Wagner, A.M. et al. Distributed Acoustic Sensing for Seismic Monitoring of The Near Surface: A Traffic-Noise Interferometry Case Study. Sci Rep 7, 11620 (2017). https://doi.org/10.1038/s41598-017-11986-4
Pendergast, R. L., Santos, R., maurya, K., Ganbat, Joost, Xaalee, Boris, Irfan, A., Imam, Raj, Cathy, David, Dunker, A., Rodrigo, Paul, Gokul, Ali, Gomer, Yannay, … Dynamics, A. (2021, October 7). Complete Guide for Ultrasonic sensor HC-SR04 with Arduino. Random Nerd Tutorials Complete Guide for Ultrasonic Sensor HC-SR04 with Arduino. https://randomnerdtutorials.com/complete-guide-for-ultrasonic-sensor-hc-sr04/
Meier, R. (n.d.). Roger Meier’s freeware. Roger Meier’s Freeware. https://freeware.the-meiers.org/
Elecfreaks. (n.d.). Ultrasonic Ranging Module HC - SR04. https://cdn.sparkfun.com/datasheets/Sensors/Proximity/HCSR04.pdf