Terahertz Electromagnetic Wave Detection
Members
Luo Shizhuo E1353445@u.nus.edu
Zhang Bohan E1349227@u.nus.edu
Project Overview
Terahertz (THz) waves are rather useful in communication (6G communication: 0.3~3 THz), astronomy (millimetre telescope: 0.22 THz) and solid state material characterisation. However, the generation and detection of THz wave so difficult that it is named as the "THz Gap".
In this project, we aim to generate and detect a THz pulse with a traditional method (Electro-Optical Sampling) and then via a commercial thermopile sensor. (Specifically, we will use LiNbO3 (LN) crystal, which is reported to be capable of generating THz pulses easily.)
This project can provide a cheaper option compared to specific THz camera (like THz fluorescence camera), and enable us to observe the pattern of THz wave in a more cost-effective way.
Theory Basis
LN-based THz pulse generation
Phase Match Condition
We assume that an electromagnetic wave goes in the direction with an angle between z axis. The electric field is given as:
where , and is the wave vector. The phase term indicates the direction of the motion. When an angular dispersion by frequency is introduce in deviation angle , the phase term becomes:
Here, is the central frequency. Substituting and for and , respectively, the formula above can be simplified to:
Hence, the speed of the wave packet (term with a low frequency ) is modified to be . The phase match condition becomes:
This shows that the phase match condition can be modulated by the parameter . In the experiment, the angle
- Exact Calculation
The THz field is generated by Difference Frequency Generation (DFG) described by:
When we substitute and for and , the equation above becomes:
Hence, the THz wave by frequency is:
where a rotation of in plane is imposed. The term represents the phase mismatch.
Electro-Optical Sampling
The Terahertz photons has so low energy (~0.003 eV) that it can hardly be detected via photodiode made up of common semiconductor (band gap: >0.5eV). Even narrow bandgap semiconductor has a bandgap in the magnitude of 0.01 eV. Hence, conventional detectors cannot directly detect Terahertz photons. Nevertheless, the variance rate of terahertz frequency is in the magnitude of picoseconds. This hints us to use pulses with a duration of 0.1 picosecond magnitude as a "shutter" to capture the shape of terahertz wave.
Optical pulses can detect the transient change of the optical property. Once the electric field of the terahertz wave alters the optical properties of the material, the probe pulse, i.e. the optical pulse, can instantaneously detect this change. This measurement technique is "Electro-Optical (EO) Sampling". When modifying the time delay between the optical pulse and terahertz wave, the optical pulse can depict the electric field of terahertz wave point by point.
In the experiment, birefringence is the most popular optical property used in EO sampling. This effect can be seen as a special sum-frequency generation . Since the frequency of terahertz wave is much lower than the optical pulse, it can be deemed as zero-frequency term in the special sum-frequency generation. Hence, the dielectric tensor becomes: . To give the refractive indices, we shall use the refractive ellipse. We reverse the dielectric tensor as . When applied Taylor expansion in the order of , we have . Here, is the dielectric tensor when there is no outer electric field, and is the EO coefficient
According to the conservation of energy density and electric displacement with and without the medium, we can normalise the conversation relation as:
where represents the direction of the outer optical field. The above quadric equation can be definitely simplified in the form of with a transformation via diagonalzing the tensor . Then, we can simply gives the Jones matrix to describe the change of the polarisation of the incident laser. The Jones matrix can be: , where we assume that the incident direction is in the z-direction (index 3).
Thermopile Detector
To detect the generated THz waves, we employ a thermopile detector, which offers a cost-effective and sensitive solution for broadband THz detection. A thermopile is a thermal detector that consists of a series of thermocouples connected in series or parallel, producing a voltage in response to temperature differences across its junctions.
When the THz radiation is absorbed by the blackened surface of the thermopile, it causes a temperature rise, generating a measurable voltage signal due to the Seebeck effect. Unlike semiconductor photodetectors, thermopiles do not rely on photon energy exceeding the material bandgap. This makes them especially suitable for detecting low-energy THz photons (∼0.003 eV), which are otherwise difficult to detect using conventional photodiodes.
In our setup, the thermopile detector is positioned to capture the emitted THz beam after passing through the optical setup. Its broadband response is likely to allows us to record the relative intensity of the THz signal under different generation or modulation conditions. Though it does not provide time-resolved measurements, its simplicity and compatibility with room-temperature operation make it a practical tool for evaluating THz pulse generation in a laboratory environment.

Thermopiles are used to provide an output in response to temperature as part of a temperature measuring device, such as the infrared thermometers widely used by medical professionals to measure body temperature, or in thermal accelerometers to measure the temperature profile inside the sealed cavity of the sensor. They are also used widely in heat flux sensors and pyrheliometers and gas burner safety controls. The output of a thermopile is usually in the range of tens or hundreds of millivolts. As well as increasing the signal level, the device may be used to provide spatial temperature averaging. Thermopiles are also used to generate electrical energy from, for instance, heat from electrical components, solar wind, radioactive materials, laser radiation or combustion. The process is also an example of the Peltier effect (electric current transferring heat energy) as the process transfers heat from the hot to the cold junctions.

Preparation for Measurements
EO Sampling with ZnTe
We use Zinc Telluride (ZnTe) for the EO Sampling. As the theory mentioned above, we shall first give out the electro-optical tensor . As reference says that the tensor can be simplified to be , where is the Levi-Civita symbol. In most references, is simplified to be .
Meanwhile, though ZnTe is isotropic, the measurement using its (110) plane [1].

Thus, we shall first rotate the frame to fit the incident plane. Now we assume that the basis is , and .
Now, we assume that the incident Terahertz wave has a polarisation in (110) plane with an angle between . The Terahertz wave vector should be . Hence, we can write out the refractive index as:
which gives Eigenvalues:
and the eigenvectors:

where . Notice that . Hence, when , we have . The refractive indices are approximately:
Hence, we find that the birefringent coefficient has a maximum at . Here, the eigenvectors, i.e., the principle axis of ZnTe, are . It shows that the angle between the new axis and the old ones is strictly 45 degree. Therefore, when the normally incident beam has a polarisation along , it would becoming elliptically polarised. Specifically, in the experiment, the linearly polarised beam would pass through a Quarter Wave Plate (QWP), then be analysed by Wollaston prism and finally collected by balance detector after passing ZnTe. The balance detector here actually consists of 2 detectors same in type.
We can thereby show the optical field after the Wollaston prism as:
where the QWP matrix is and the rotation matrix representing a rotation of 45 deg is . Hence, the formula can be simplified as:
In the experiment, we extract the difference between the signals from the 2 detectors via lock-in amplifier. As the intensity , the final measurement would gives:
Therefore, we can inversely give the electric field of Terahertz wave as:
Modification given finite time constant in the circuit
In the measurement, we use a source of 2 kHz laser and the frequency of chopper is set to be 1 kHz. However, due to the time constant in the circuit, we saw periodic exponential-like signal other than Dirac delta signal as expected.

Here, we analyse how the exponential data would affect the result. Assume that the detector is not saturated. Hence, in 1 period, the signal would be the sum of all past exponentially-decaying signals:
where is the time constant of the detector and is the period of the signal. Given a periodic continuation of the signal, we can give the Fourier components by:
where frequency is a discrete variable. In the experiment, we measure the Terahertz wave in frequency and the optical intensity in frequency . Therefore, the lock-in outputs and the real values should have a relation as:
where we define as the signal distortion rate. This relation shows that when , the real value might be 2 times of the outputs, verified by our program. The distance between the theory and the data comes from the 2nd order Fourier component of , where .

Here, the time constant is . This shows that the signal distortion rate is . This shows that the signal distortion has little influence on the final result. Thus, we neglected it.
Measurements and Setups
EO Sampling Setup

Firstly, we try to detect the Terahertz wave with the most traditional method, electro-optical sampling, to demonstrate that we are truely measuring the terahertz wave. This is because the the EO sampling actually measures the wave shape of the Terahertz pulse with a resolution of 0.07 ps which is much smaller than the period of the terahertz wave (2 ps). Hence, we expect to see a oscillation signal representing the electric field of the terahertz wave. Then, we can compare the wave to others result, thereby demonstrating that this pulse is terahertz wave.
The setup (figure in the right) mainly consist of 3 parts, pump path for generating terahertz wave (red one), terahertz wave path (blue one) and the probe path for EO sampling (green one). All pump and probe beam are 2 kHz, 1030 nm Yb:YAG laser with a duration of about 200 fs. The pulse energy was about 400 J.

Pump Path
The delay line is used to control the time delay between the THz pulse and the probe pulse. Then, a telescope with a cylindrical convex lens (f=100 mm) and a conjugate concave lens (f=-50 mm) compresses the beam in the direction perpendicular to the table. The grating then introduces a tilt in the wavefront of the pulse. Subsequently, the pulse will be imaged into the Lithium Niobate (LN) crystal with another telescope. The second one consist of cylindrical convex lens with focal lengths of 50 mm and 100 mm. The Half-Wave Plate (HWP) before the grating is used to optimise the efficiency of the grating, while the one before LN crystal ensures that the polarisation of the beam aligns with the d33 axis to give a maximum THz generation efficiency. The chopper here is 50:50 with a frequency of 1 kHz.

Probe Path
The probe beam has an energy that is much smaller than the pump path to protect the EO crystal (Zinc Telluride, ZnTe) and the photodiode detectors. When attenuated by the HWP and Polarisation Beam Splitter (PBS), the probe beam would firstly go into a delay path to match the time delay in the pump path. Then, a convex lens with a focal length of 150 mm focuses the beam on the ZnTe to detect the change of birefringence due to Terahertz pulse. Then, the beam is collimated by a conjugated convex lens with a focal length of 50 mm and analysed by the Wollaston prism. The splitted beams would go into 2 same detectors. Experimentally, the linear range of the photodiode on the lock-in amplifier is about from 0~9 mV in our setup.

Terahertz Path
The Terahertz path is collected by the first Off-Axis Parabolic mirror (OAP) with a focal length of 76.2 mm. Then, it's collimated by conjugated OPA with focal lengths of 76.2 mm and 101.6 mm. In the end, it would be focused by the final OPA on the ZnTe. The OPA here has a tiny tunnel to allow the 1030 nm probe beam to pass. In the alignment of the Terahertz path, we introduce a laser beam from He-Ne laser in the opposite direction of the Terahertz wave after the Zinc Telluride to simulate the Terahertz wave. Here, we also make sure that the He-Ne laser well overlapped with the probe path. This was because that our target is to ensure the collinearity of the probe beam and the Terahertz wave. In the first step, the spot of the He-Ne laser was supposed to be at the same position of the focal spot of the pump 1030 nm laser in the LN crystal.
When all setups were in almost correct positions, we could detect a THz-like wave. Then, we optimised the angle of the grating and the tilts of the second OPA to obtain a THz wave as intense as possible. During the optimisation, the delay stage should also be moved to try to detect the peak electric field of the THz wave.
EO Sampling Results
The basic goal of EO Sampling is to demonstrate that we have actually measured the Terahertz wave. In the EO sampling, the sum of intensities captured by the photodiodes was 5.87 mV to ensure that the intensity-voltage relation of photodiodes were linear. The sum of the intensities were obtained when the Terahertz wave stopped and the frequency of the lock-in was locked to 2 kHz.


Here, we show the result of the EO sampling. We are sure that we have measured the Terahertz pulse given 3 solid reasons:
1. Since the humidity in the lab was about 50% to 60%, the Terahertz wave should perform absorption peaks. The peaks in the spectrum well aligns with the water vapour absorption peaks at 0.557 THz and 0.753 THz. [2] Thus, we are sure that it should be a THz wave.
2. The frequency range of the Terahertz pulse is about 0.1 THz to 1 THz, which matches other articles' conclusion. [3]
3. The time-domain shape of the pulse presents a manifest chirp. Since a common Terahertz wave generated by LN crystal should have no oscillation "tails" after the main peak. This chirp should be interpreted as a consequence of the high humidity in the lab. Similar phenomena are observed in other research. [4]
Therefore, from the EO sampling, we are sure that we have detected the Terahertz pulse generated by the Lithium Niobate. The Signal-to-Noise Ratio (SNR) of the intensity in spectrum is about 32 dB given a Terahertz pulse with a maximum electric field of 3 kV/cm in time domain. Since the Fourier Transform is invariable without loss of information, the SNR keeps constant after the Fourier transform [5]. Hence, the SNR of the electric field in time domain is also around 32 dB. This shows that the relative noise of the setup is around 0.0631%.
Given the full data of the pulse, there are other 2 manifest peaks after the main peak. These peaks might come from reflection in the pump pulses that excite some other weak Terahertz pulses.


Thermopile Sensor Setup
In our second attempt, we try to detect the Terahertz pulse directly via a thermopile sensor (Thorlabs S405C). The figure below shows our setup. The filter before the sensor is not explicitly shown on the figure.


In the previous EO sampling experiment, we have shown that the Terahertz wave does exist. Now we tried to detect the Terahertz wave in the same setup. According to previous articles, the possible power that we could detect was in the magnitude of 0.1 mW (maximum efficiency ~ ), while the theoretical power resolution was 5 W.
Results with the thermopile sensor
Discussion
Source for Codes
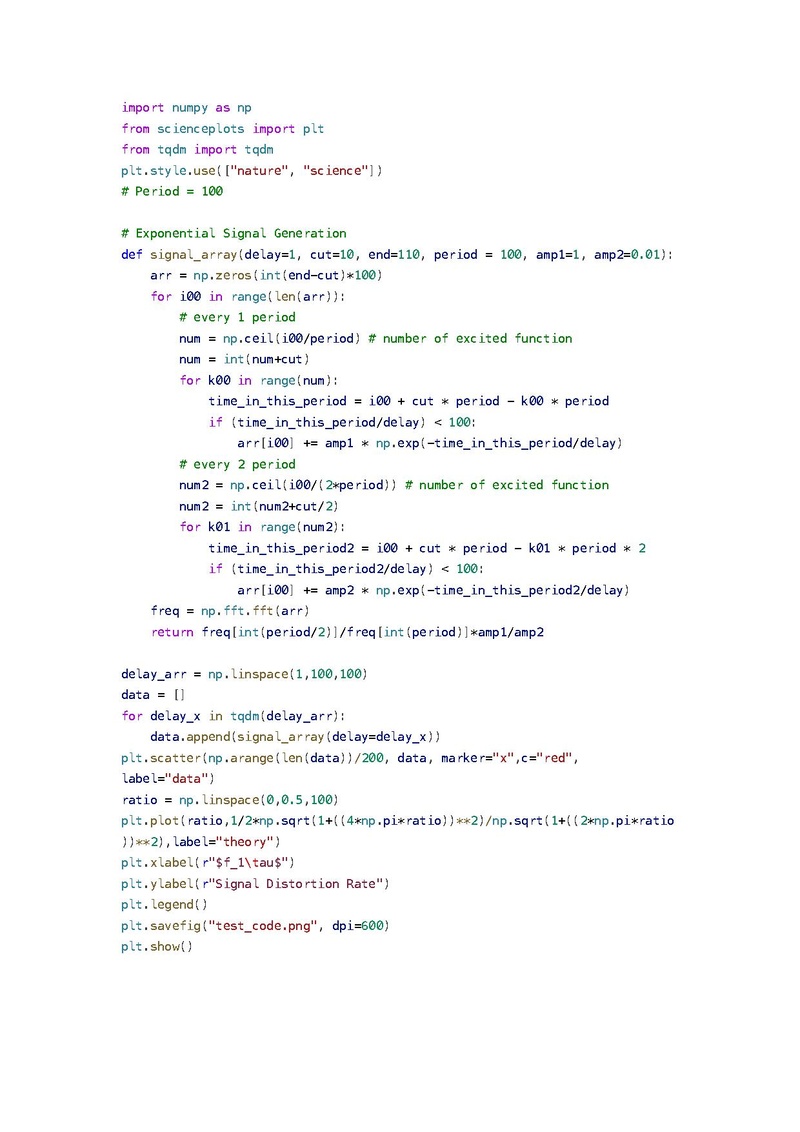
Test Program for Signal Distortion
Here is the function defined in Python to generate the signal distortion with given parameters.
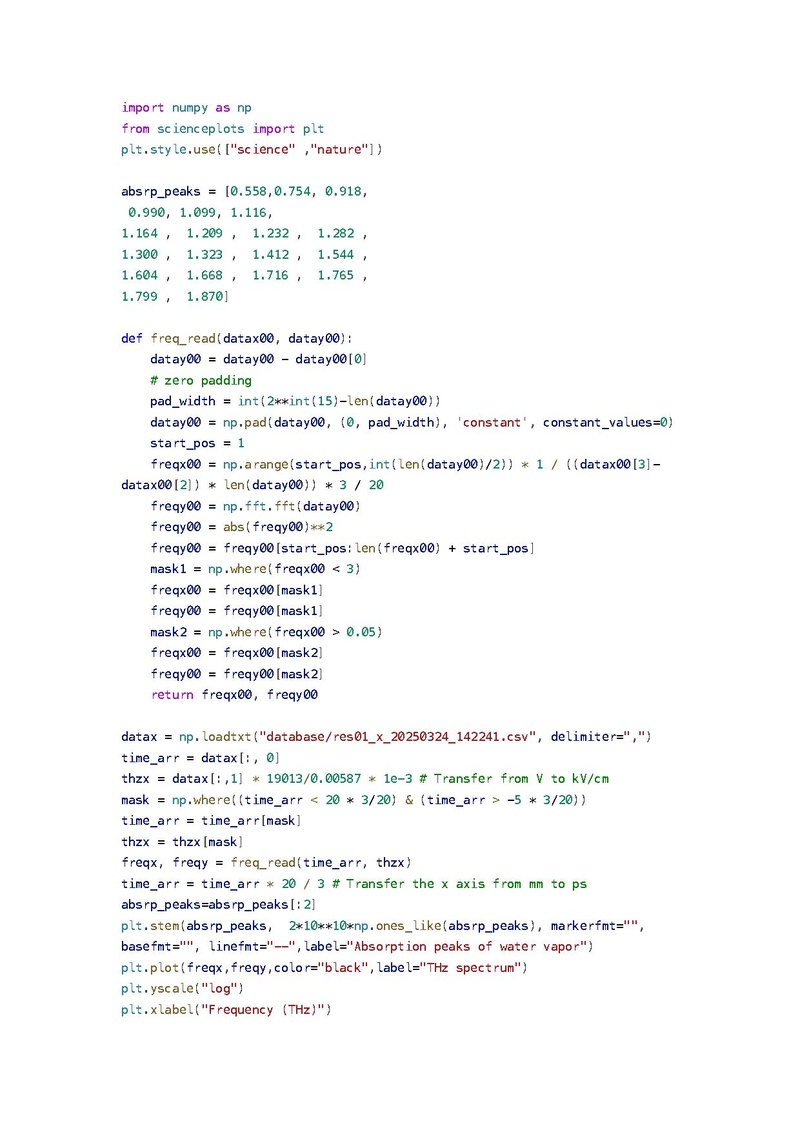
Spectrum Analysis Program
Here is the spectrum analysis program in Python.
Reference
[1] Steffen, Bernd Richard. "Electro-optic methods for longitudinal bunch diagnostics at FLASH." (2007).
[2] Xin, Xuying, et al. "Terahertz absorption spectrum of para and ortho water vapors at different humidities at room temperature." Journal of applied physics 100.9 (2006).
[3] Wu, Xiaojun, et al. "Generation of 13.9‐mJ terahertz radiation from lithium niobate materials." Advanced Materials 35.23 (2023): 2208947.
[4] Lin, Chiajen, Ichen Ho, and X. C. Zhang. "Study of broadband THz time-domain spectroscopy at different relative humidity levels." Chinese Optics Letters 10.4 (2012): 043001.
[5] Bosworth, Barry T., et al. "Estimating signal-to-noise ratio (SNR)." IEEE Journal of Oceanic Engineering 33.4 (2009): 414-418.