Optical measurement of atmospheric carbon dioxide
Team members
Ta Na: Responsible for proposing and refining ideas, coordinating experimental records, documenting the experimental process, generating graphs, analyzing experimental data, drawing conclusions, experimental advantages and improvements, making comparisons, preparing appendices, and formatting.
Cao Yuan: Responsible for refining ideas, leading experimental operations, deriving the experimental principles and related formulas and experiment setup section, and formatting.
Gao Yihan: Responsible for assisting with experimental operations and writing the research background, experimental objectives, experimental advantages and improvements, and referencing.
Qi Kaiyi: Responsible for purchasing the materials for use and error analysis.
Chen Yiming: Responsible for assisting with experimental operations and writing the research background, experimental objectives, experimental advantages and improvements, and referencing.
Background
Carbon dioxide (CO₂) is a prominent greenhouse gas whose rising concentration plays a critical role in climate change. In the atmosphere, CO₂ molecules absorb Earth’s outgoing infrared radiation in specific wavelength bands, notably around 15, 4.3, 2.7, and 2 μm, which causes heat to be trapped and contributes to atmospheric warming.[1] Indeed, empirical climate analyses have identified increasing CO₂ levels as a primary driver of recent global warming.[2] This dual significance of CO₂—as both an essential climate variable and a gas requiring careful monitoring—motivates the development of accurate sensing technologies.
Infrared (IR) absorption spectroscopy provides a robust physical principle for detecting gases like CO₂ by exploiting their unique vibrational absorption fingerprints. When IR light at certain wavelengths passes through a gas, molecules that have vibrational modes resonant with those wavelengths will absorb energy, reducing the transmitted light intensity. Polyatomic gases such as CO₂ exhibit strong vibrational-rotational absorption features in the mid-IR region (e.g., near 4.3 μm) that can be measured for quantification.[1] The relationship between absorbed light and gas concentration is governed by the Beer–Lambert law, which states that the intensity of transmitted light decays exponentially with the path length and concentration of the absorbing species.[3] In practice, this means the amount of IR attenuation at a characteristic wavelength is directly related to the CO₂ concentration along the optical path, enabling concentration measurements via absorbance. Non-dispersive infrared (NDIR) sensors are built on this principle by using a broadband IR source and a detector with an optical filter to isolate the wavelength of interest, yielding a selective and linear response to the target gas under most conditions.[4]
Among the infrared bands of CO₂, the asymmetric-stretch fundamental near 4.3 µm is particularly suited to sensing. At this wavelength the transition dipole moment is large, so even trace-level concentrations yield a measurable attenuation of the incident beam.[4] Spectroscopic surveys show that the integrated absorption at 4.3 µm exceeds that of the next-strongest fundamental band at 15 µm by roughly one order of magnitude, and is about two orders of magnitude stronger than the overtone combination band around 2.7 µm.[5] Independent modelling of atmospheric spectra confirms that the 4.3 µm and 15 µm bands are, respectively, the first- and second-most intense mid-IR features of CO₂.[1] This exceptionally high line strength translates into superior signal-to-noise performance for compact non-dispersive infrared (NDIR) sensors: by isolating a narrow window centered on approximately 4.3 µm, the detector can quantify CO₂ selectively with minimal cross-interference from other gases.[4] The pronounced absorption at this line therefore underpins our decision to base the instrument’s optical filter on the 4.3 µm peak.
Purpose
This project’s purpose is to develop a portable, low-cost CO₂ concentration measurement device based on infrared absorption spectroscopy. The aim is to design and construct an instrument capable of accurately quantifying CO₂ levels in ambient air by detecting the attenuation of IR radiation at the 4.3 μm absorption band of CO₂. By leveraging the selectivity of this mid-IR spectral feature, the device will provide reliable measurements of CO₂ while remaining compact and energy-efficient, making it suitable for field use or continuous environmental monitoring.
To achieve this, a broadband thermal infrared source together with an optical band-pass filter and a thermopile detector are employed as the sensor system, following the classic NDIR configuration. The broadband IR emitter (for example, a heated filament) will produce radiation encompassing the 4.3 μm wavelength, and a narrow band-pass filter centered at ~4.3 μm will isolate the specific CO₂ absorption band.[4]
As the IR beam passes through the sample gas chamber, CO₂ molecules absorb a fraction of the light at this wavelength, and the thermopile detector (sensitive in the mid-IR range) measures the transmitted IR intensity. The use of a thermopile provides a cost-effective and robust means of converting infrared energy to an electrical signal, but it also necessitates strategies to enhance the detection of small absorption-induced changes. Therefore, a lock-in amplifier technique will be integrated into the detection electronics to improve the signal-to-noise ratio. By modulating the IR source (for instance, with a chopper or by driving it with a sinusoidal waveform) and synchronously demodulating the detector output, the system can extract the CO₂ absorption signal from background noise with high fidelity.[4] This approach effectively amplifies the desired signal and filters out low-frequency drift or random noise, as demonstrated in prior CO₂ sensor research.[4] Overall, the purpose of the project is to realize an IR-based CO₂ sensing device that combines selectivity, sensitivity, and portability – using inexpensive components and innovative signal processing – to facilitate accurate CO₂ monitoring outside the laboratory setting.
Key objectives
- Accurate quantification of CO₂ via IR absorption: Develop the device to reliably measure carbon dioxide concentrations, ensuring that the IR absorption at 4.3 μm can be translated into an accurate quantitative reading of CO₂ levels. This entails calibrating the sensor and optimizing its design so that the CO₂ concentration is determined with high precision and accuracy.
- Verification of Beer–Lambert law relationship[3]: Experimentally validate that the sensor’s response obeys the Beer–Lambert law, i.e. that the measured IR absorbance varies in a predictable manner with CO₂ concentration and optical path length. This objective will confirm the linear (or known non-linear) relationship between concentration and absorption within the operating range, reinforcing the scientific basis of the measurement.
- Performance evaluation under varied conditions: Rigorously evaluate the sensor’s performance across a range of operating conditions. This includes testing under different environmental conditions and CO₂ levels to assess the device’s stability, repeatability, and accuracy. The goal is to ensure the sensor maintains consistent performance and can distinguish CO₂ concentration changes despite potential external influences or interfering gases.
Idea
Possible measurement mechanisms
- Spectroscopy. Carbon dioxide has absorption peaks at 15, 4.3, 2.7 and 2 μm. With a laser/source of such wavelength and the correct filter, we could judge the concentration by absorption levels. See viasala for inspiration of a potential real-time reference design.
- Interferometry. Carbon dioxide has a slightly different refraction index for all wavelengths. By observing the change in interference patterns, we can tell if there is a change in carbon dioxide concentration due to a change in effective path length.
In the end we chose single-wavelength spectroscopy, i.e. absorbance measurement to measure the CO2 content.
Experiment Preparation
Components
- Light source:
- A thermal/blackbody radiation/light source that can emit EM radiation at 4 micrometers. Done with a 12W halogen lamp, mounted on an IKEA SVALLET lamp stand.
- Sensor:
- Thermopile detectors: G-TPCO-035 / TS418-1N426: Thermopile detector with a built-in optical bandpass filter for light around 4μm wavelength for CO2 absorption
- multimeter (SANWA RD700 digital multimeter)
- Gas chamber:
- airtight acrylic box surrounding all optical components (chosen)
- metal (stainless steel) extrusion with hollow structures sealed with transparent SiO2 cover glass (chosen)
- gas chamber with specific materials (Si/SiO2) transparent to 4μm wavelength
- Power supply and micellaneous electronics:
- banana wires
- KEITHLEY 2231A-30-3 Triple channel DC power supply)
- CO2 source:
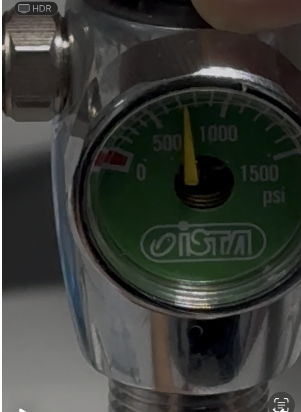
- disposable CO2 cylinder (95g) manufactured by Zong Yang Aquarium Co. LTD.
- dry ice
Experiment Principles
The experiment is based on the absorption of CO2 of 4μm-wavelength infrared light. This absorbance is dependent on the extinction coefficient of CO2, which is dependent on its partial pressure, and the distance the light travels. It could be described using the Beer-Lambert Law:
while Fr is the flux density the thermopile detector receives, Fi is the flux density of the source, β is the extinction coefficient and s is the distance.
Yet G-TPCO-035 / TS418-1N426 does not include any kind of flux/temperature/energy to voltage conversion curve in its spec sheet. This means an assumption needs to be made for the flux density-voltage relation of the thermopile detector. We assume the flux density-voltage relation is linear (linear F-V assumaption), i.e. it follows:
while k is a non-zero constant and b is a constant. Both k and b are unknown and not required to be known for our purposes. To overcome this, we designed our general experiment procedure as follows:
- Pump in CO2 and maintain its stability without turning on the light, and take the first measurement at t=0s.
- Turn on the light, take the measurements for t=3s, 10s, 20s and 30s or else, respectively.
- Switch off the light until properly cooled to room temperature while releasing the CO2 gas back into the room.
- Above entails a single experiment. Repeat measurements.
As a result, two more assumptions are made for this experiment:
- The partial pressure of CO₂, thus the extinction coefficient, remains constant during each experiment. (constant β assumption)
- The incident flux density at each moment, i.e. t=0s, 3s etc. remains constant in each day's experiment, assuming the heating of the bulb is regular across experiments. (incident flux assumption)
It follows that within any single experiment, the difference between measurements at different moments should be proportional to the difference between Fr at respective moments, and thus proportional to the exponential term of the Beer-Lambert Law. Mathematically it writes
Then, given the assumptions, , which in turn gives us the expression for the measured extinction coefficient:
As literature tells that βair = 0.535 cm-1, we can figure out the extinction coefficient at any given moment with the presence of CO2 with the help of a reference measurement with air. Hence the partial pressure of CO2 can be described as:
Note that these assumptions are not perfect. Problems such as gas leakage and temperature disturbance can strongly undermine the validity of the constant β assumption, while manual control of the light source, timing and logging of the data may also undermine the accuracy of the incident flux assumption. As experiment setup upgrades, these assumptions prove to be more valid as will be shown in later parts of the page.
Experiment process
Experiment 1
In the initial phase of the study, the pre-designed and precision-fabricated acrylic panels were assembled to construct an airtight chamber intended for the containment of carbon dioxide (CO₂) gas. Following assembly, the experimental setup, as illustrated in the accompanying figure, was employed to preliminarily introduce CO₂ into the chamber using methods such as syringe injection and balloon release. However, it was observed that these approaches yielded limited gas inflow, failing to achieve the target concentration levels required for reliable measurements. To overcome this limitation, the methodology was refined by directly placing dry ice (solid CO₂) within the chamber and employing controlled heating to expedite its sublimation, thereby substantially increasing the internal CO₂ concentration. Throughout the process, a high-precision multimeter was utilized to continuously monitor the sensor’s voltage output, which correlates with variations in light intensity caused by changes in CO₂ concentration. As described before, the relation satisfies:
As literature tells that βair = 0.535 cm-1, we can figure out the extinction coefficient at any given moment with the presence of CO2 with the help of a reference measurement with air. Hence the partial pressure of CO2 can be described as:
The recorded voltage values, representative of transmitted light intensity, were subsequently converted to CO₂ partial pressures and corresponding concentrations. The resulting concentration-time profiles were plotted to analyze the gas dynamics within the system.
Experiment setup
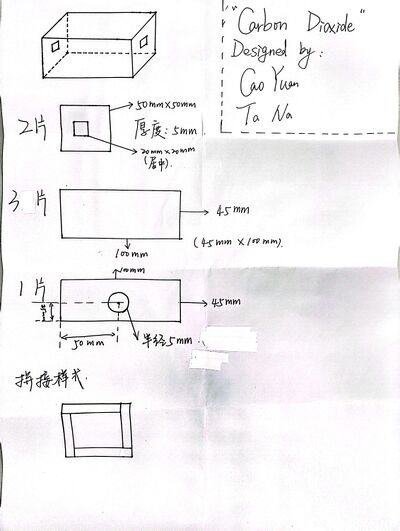
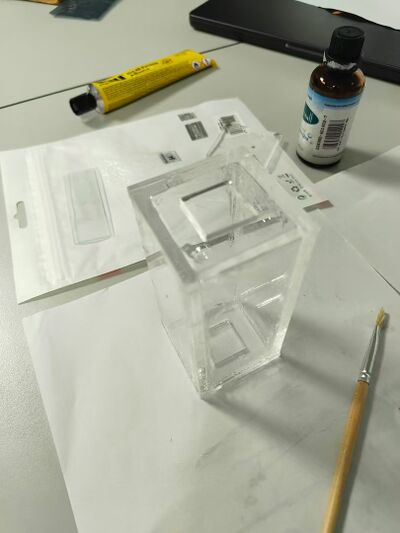
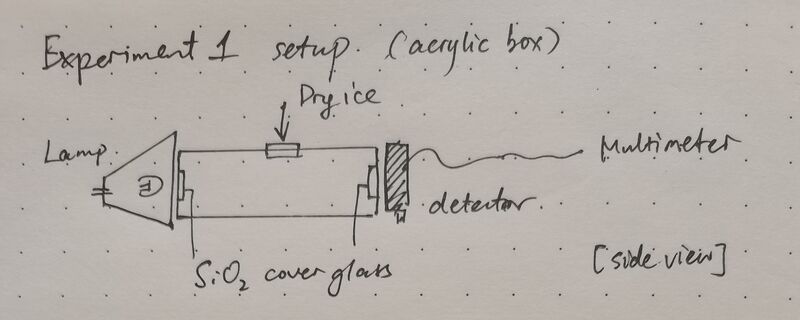
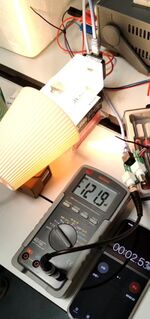
For the first experiment, an acrylic gas chamber was designed as in Figure 2. On either side, a piece of 2 μm thick cover glass was sealed to allow light transmittance and avoid gas leakage. A window is left on top to allow the injection of CO2 or dry ice. After injection, the window will be manually sealed. The center of the lamp, gas chamber and detector are aligned on the same horizontal line. Once fixed, they are not moved around for the day during experiments.
Gas is injected/dry ice is put in the chamber before experiments start. Data are recorded at t=0s, 3s, 15s and 30s after switching on the light. The rest of the procedure follows what's written in Experiment principles.
Data acquisition and analysis
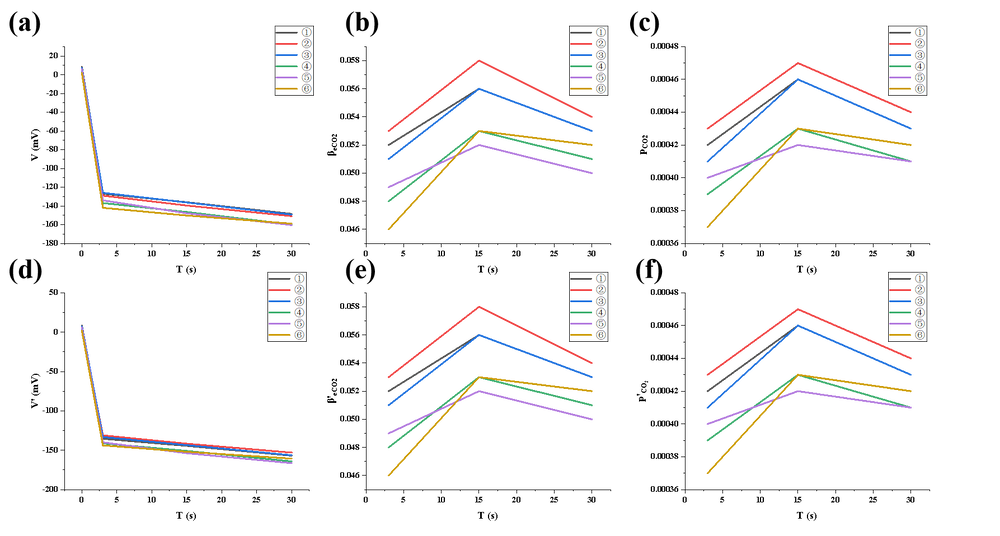
In the first experiment, dry ice sublimation was employed to introduce CO₂ gas into a sealed chamber. The voltage showed a slow declining trend, with relatively small changes in concentration, indicating limited gas release rates and a long time required to reach equilibrium. Moreover, non-uniform gas distribution was likely present. Overall, this experiment demonstrated that dry ice sublimation is feasible for basic CO₂ detection, but it suffers from slow concentration buildup, considerable data fluctuation, and poor system responsiveness, making it more suitable for low-precision, preliminary testing scenarios.
Trend summary:
① Voltage decreased quickly as soon as the light was on and decreased slowly after.
② β value gradually increased (indicating rising CO₂ concentration) and reached the top at about 15s. Yet some β values are even smaller than atmospheric levels, meaning either there is leakage or the amount of CO₂ is not enough for it to be distinguishable.
③ p values stabilized around 0.037%–0.047%, with minor variations.
④ System most probably didn’t reach a stable state due to high variations.
Advantages: Simple assembly, easy to operate.
Disadvantages: Uncontrolled gas release, slow response, significant data fluctuations, limited repeatability.
Experiment 2
Experiment setup
Informed by the limitations identified in the first experiment, particularly regarding insufficient gas filling and suboptimal sealing, the second experimental phase incorporated significant improvements. A metal extrusion with enhanced airtightness was selected as the container, and an inlet port was fabricated on the top of the vessel, matching the connector of the CO₂ gas cylinder, thus enabling direct, stable, and efficient gas injection. The other end of the metal extrusion, i.e. the one facing the detector, is not sealed to ensure the pressure of the gas chamber is not too high. The complete setup is as follows:
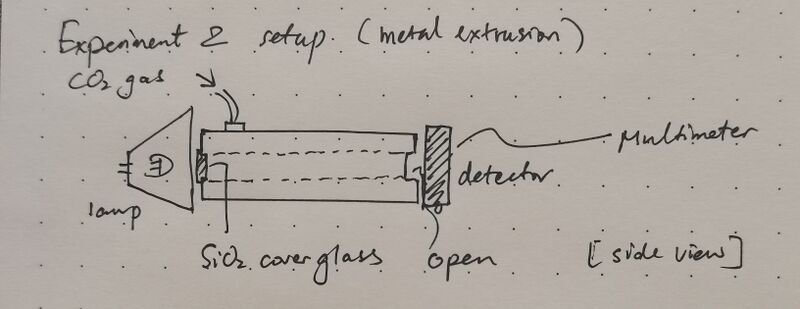
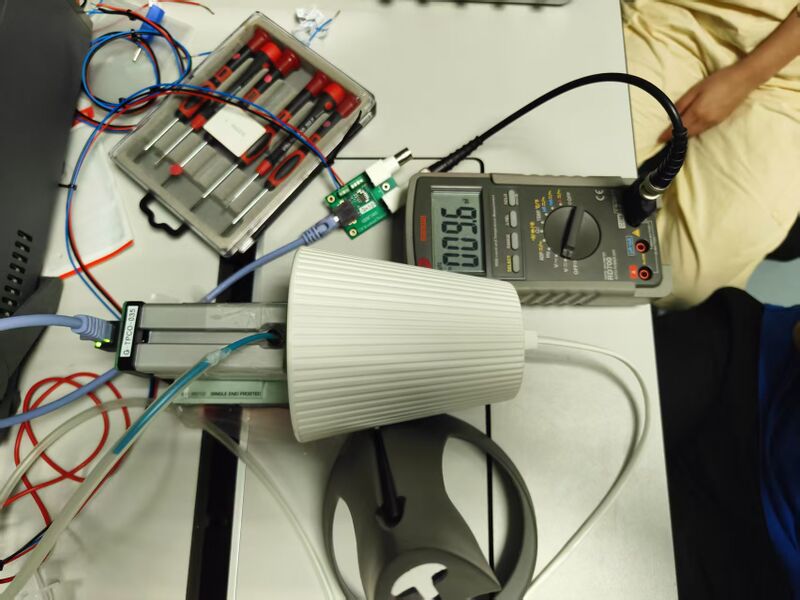
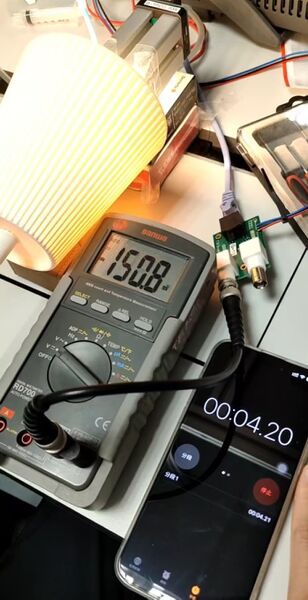
During the experiment, voltage outputs were recorded at finer temporal resolutions using a high-precision multimeter. The data processing followed the same theoretical framework as in the first trial, translating voltage measurements into CO₂ concentration values. The acquisition of a greater number of data points across a broader time range substantially improved the continuity and resolution of the resulting concentration profiles, thus enhancing the reliability of the experimental results. The gas cylinder injection efficiency is approximately 7 times faster than the dry ice method.
This time data acquisition happens at t=0s, 3s, 10s, 20s, and 30s after switching on the light. The rest of the procedure remains the same.
Data acquisition and analysis
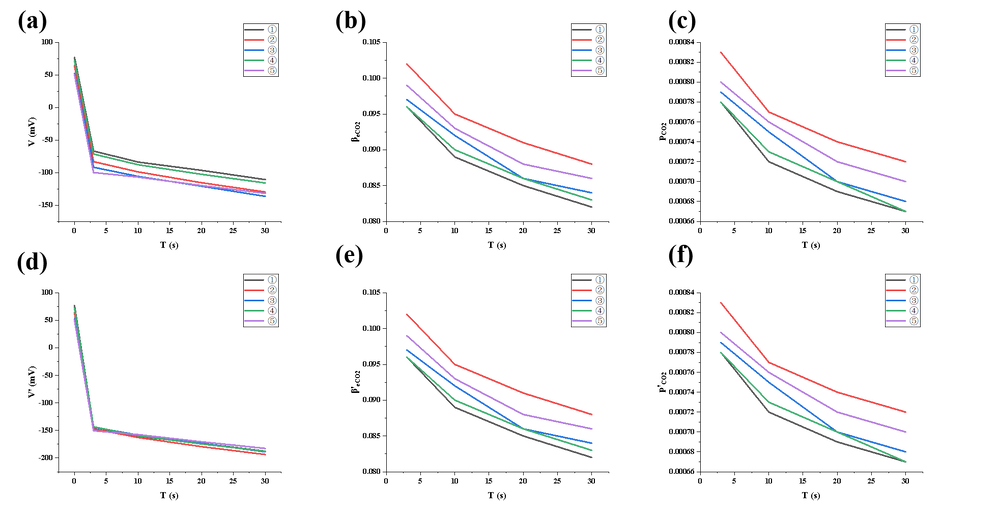
In the second experiment, a direct injection of high-purity CO₂ gas from a cylinder was utilized via a well-sealed port into the chamber. Compared to the first experiment, the concentration increased much faster, and the voltage decline curve was smoother, indicating that the gas injection method significantly improved CO₂ supply efficiency and reduced issues of non-uniform distribution. However, slight gas saturation or localized pressure fluctuations might still occur under high flow rates. This experiment is thus suitable for applications requiring rapid establishment of medium-to-high concentrations with good data continuity, although careful control of the injection rate remains necessary.
Trend summary:
① Voltage dropped rapidly the same way it was in the previous experiments.
② β values were significantly higher than in the first experiment, indicating more CO₂ were pumped into the chamber.
③ p values quickly stabilized around 0.07%–0.08%, with a smoother trend.
Advantages: Fast injection, rapid concentration increase, continuous data.
Disadvantages: Potential localized gas saturation if CO₂ injection is too rapid, minor signal drift. The air is constantly flowing, meaning fluctuations are expected and the gas pressure may not be as high as 1 atm.
Experiment 3
Experiment setup
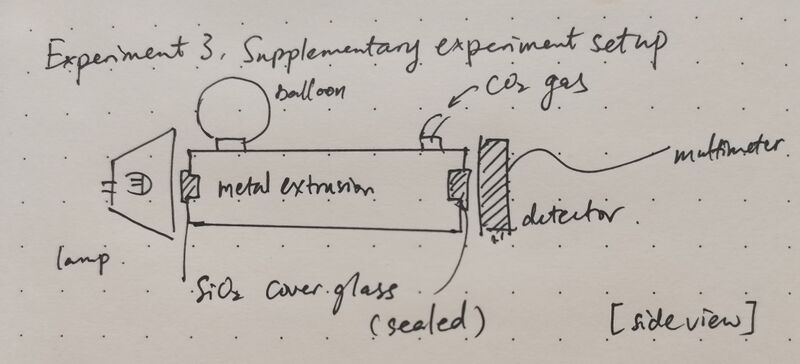
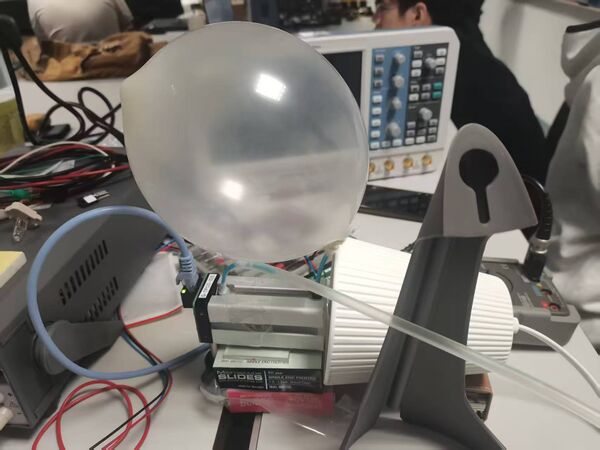
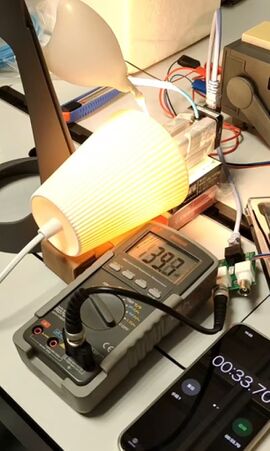
Building upon the findings of the second experiment, issues such as gas saturation and minor leakage were further addressed. In response, a structural modification was implemented by introducing an additional outlet port connected to a balloon, which served as a reservoir for the excess gas. This design mitigated the effects of pressure accumulation and prevented over-saturation, thereby stabilizing the internal environment of the chamber. The measurement protocol adhered to the previously established methodology. To further enhance the precision and temporal resolution of the data, the interval between successive measurements was shortened, and the frequency of data recording was increased. As a result, the concentration-time profiles exhibited improved continuity, accuracy, and reproducibility, providing a more robust basis for subsequent analysis.
Data acquisition and analysis
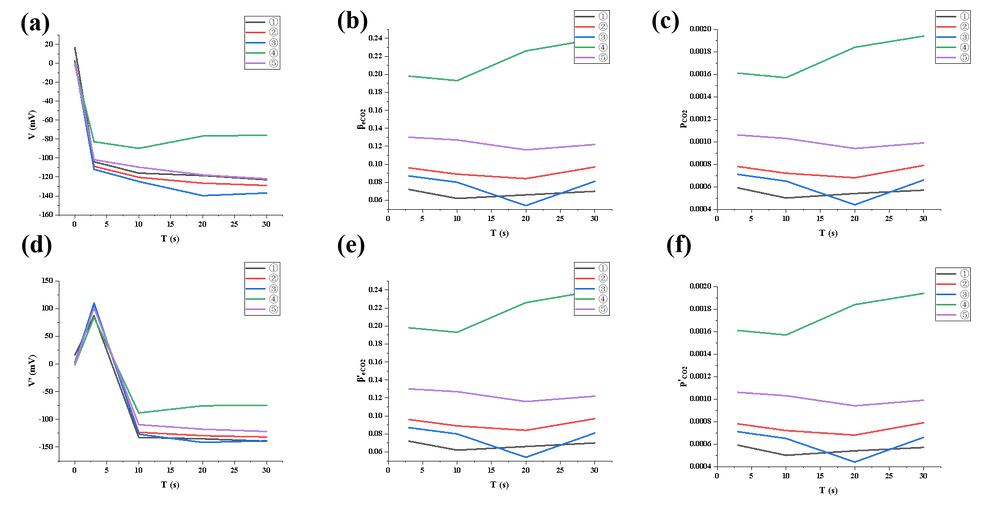
In the third experiment, the system was further optimized by adding an exhaust port connected to a balloon on the basis of direct gas injection, thus balancing internal chamber pressure and improving gas flow uniformity. The data exhibited a more rapid and extremely smooth voltage drop, with concentration rising steadily and no noticeable drift. The system's response time was significantly shortened, and the gas distribution was uniform, avoiding local saturation. The third experiment achieved the best performance in terms of gas injection efficiency, system stability, data continuity, and measurement repeatability among all experiments, making it highly suitable for high-sensitivity, high-precision CO₂ detection. The gas concentration increase is 36% faster in the third experiment, with more stable flow. However, it also demands higher standards for operational control and sealing quality.
Trend summary:
① Concentration increased even faster due to airtight environment.
② β and p values were highly stable with minimal drift, reassuring great airtightness.
Advantages: Uniform gas flow, fast response, highly repeatable data.
Disadvantages: More complex structure, requires precise control of injection flow rate.
Supplememntary experiment
Experiment setup
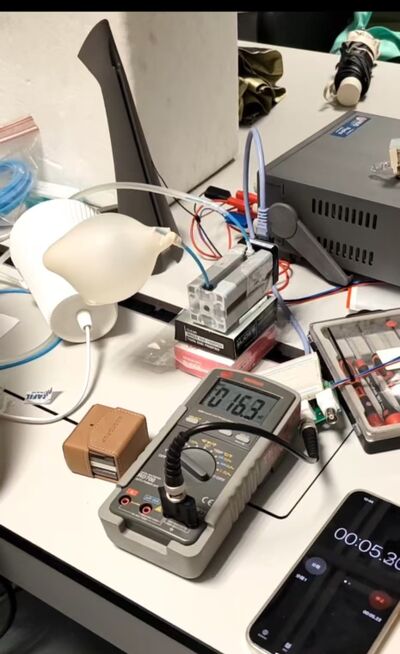
To rigorously validate the effectiveness and reliability of the experimental setup, a supplementary control experiment was performed. Under identical experimental conditions, CO₂ gas was introduced into the chamber without the application of an external light source. The voltage outputs were continuously monitored to assess any background fluctuations. The results indicated stable voltage readings in the absence of illumination, with negligible signal drift, thereby confirming the system’s high specificity and excellent baseline stability. This control validation further substantiates the credibility and accuracy of the primary experimental measurements.
Data acquisition and analysis
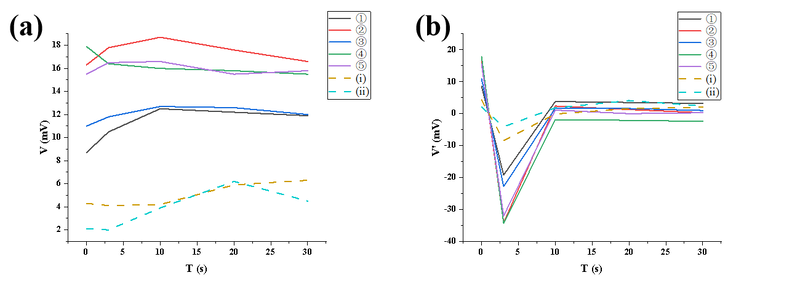
In the supplementary experiment, all external light sources were turned off, and only CO₂ gas was injected into the chamber to assess the system's electrical stability. Due to the absence of light, it was not meaningful to calculate β and p values using the absorption model. The linear voltage decay was attributed primarily to electrical background noise, such as capacitor discharge or ground loop interference, rather than any direct optical absorption by CO₂. This supplementary experiment successfully validated that the system exhibits a certain degree of baseline electrical drift in the absence of light, underscoring the necessity of maintaining a stable light source and minimizing electrical interference during formal measurements, and providing a reference basis for error correction.
① β and p could not be meaningfully calculated, indicating that the observed changes originated from electrical noise rather than optical absorption.
② The voltage change is linear, which differs from CO₂ optical absorption curves.
③ This confirms that the change comes from electrical system background drift rather than gas absorption.
Comparative studies
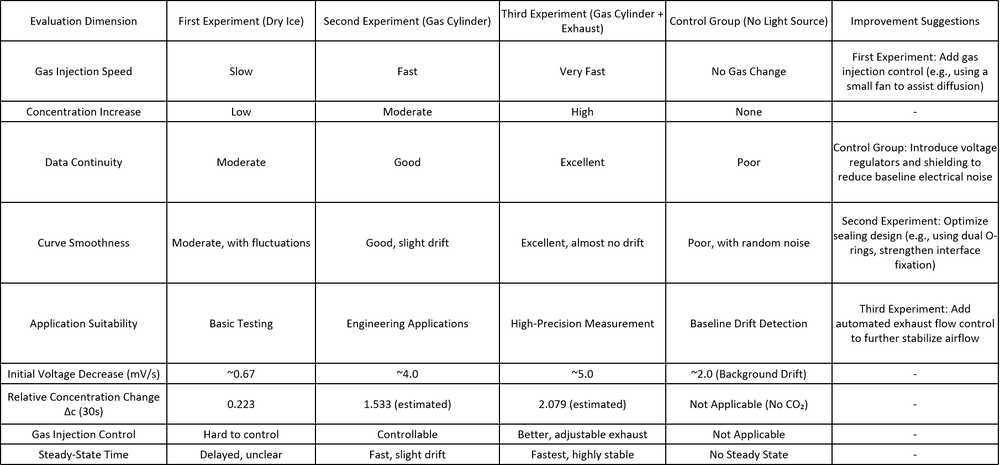
1. Experiment Setup Overview
First Experiment (Dry Ice Sublimation):
 Method: Dry ice sublimation for CO₂ release.
 Characteristics:
   - Slow gas release rate.
   - Small concentration changes.
 Suitability:
   - Best for basic testing, unsuitable for high-time-resolution applications due to slow response.
Second Experiment (Direct Gas Cylinder Injection):
 Method: Direct injection of CO₂ from a gas cylinder.
 Characteristics:
   - Faster CO₂ concentration increase compared to the first experiment (approx. 7 times).
   - Minor local pressure fluctuations.
 Suitability:
   - Improved stability and smoother data but still exhibits minor fluctuations.
Third Experiment (Gas Cylinder + Exhaust System):
 Method: Gas cylinder with an exhaust outlet for improved CO₂ release.
 Characteristics:
   - Fastest CO₂ concentration increase.
   - Smooth and stable data curves with the shortest system response time.
 Suitability:
   - Offers the best overall performance for real-time, high-precision monitoring.
   - Provides the most stable data and the most reliable system performance.
Control Group (No Light Source):
 Method: Experiment under dark conditions to observe background drift.
 Characteristics:
   - Demonstrated baseline electrical drift, highlighting the role of light stability and noise suppression.
---
2. Key Findings and Conclusions
CO₂ Concentration Rate and Stability:
 First Experiment: Slow concentration change, insufficient for high-time-resolution measurements.
 Second Experiment: Faster concentration increase (~7x faster than the first), stable but with minor fluctuations.
 Third Experiment: Fastest concentration increase, most stable and smooth data, ideal for high-precision monitoring.
System Response Time and Precision:
 First Experiment: Slow system response time, poor stability.
 Second Experiment: Faster response time, stable data with minor local fluctuations.
 Third Experiment: Fastest system response with the most precise data.
Background Noise and Stability:
Control Group: Confirmed background electrical drift, underscoring the need for light sources to suppress this noise during measurements.
Optimization Insights:
 - The third experimental setup provides the most robust solution, achieving high time resolution, precision, and repeatability.
 - The control experiment validated the presence of background drift, reinforcing the importance of light sources in experiments.
---
3. Comparative Advantages
First Experiment:
 Advantages: Simple setup, intuitive operation, suitable for basic testing.
 Suitable For: Preliminary tests or situations where quick, low-precision measurements are acceptable.
Second Experiment:
 Advantages: High gas injection efficiency, significantly reduced measurement time.
 Suitable For: Faster CO₂ concentration increase, suitable for less demanding applications where minor fluctuations are acceptable.
Third Experiment:
 Advantages: Best gas concentration control, highest data continuity, strongest system stability.
 Suitable For: Real-time, high-precision monitoring of CO₂ concentrations.
Control Group:
 Advantages: Validated the presence of background electrical drift.
 Suitable For: Baseline referencing, ensuring proper experimental conditions for measurements.
---
4. Comparative Disadvantages
First Experiment:
 Disadvantages: Difficult to control gas concentration, significant data fluctuations, low stability.
 Limitations: Not suitable for real-time, high-precision measurements.
Second Experiment:
 Disadvantages: Minor leakage or localized gas over-concentration in some stages.
 Limitations: Still exhibits minor data fluctuations, not as stable as the third experiment.
Third Experiment:
 Disadvantages: Increased system complexity, higher operational demands.
 Limitations: More complex setup compared to the first and second experiments, requiring more advanced operational expertise.
Control Group:
 Disadvantages: Cannot be used for effective gas concentration measurement, only for background noise referencing.
 Limitations: Not applicable for real-time CO₂ monitoring.
---
The third experimental setup proves to be the most effective in achieving high data precision, stability, and time resolution, making it the best choice for real-time CO₂ concentration monitoring. Future improvements should focus on enhancing the system's electrical stability, automating data acquisition, and improving flow control mechanisms for even greater experimental accuracy.
Error analysis
Sources of Experimental Error and Analysis (major errors are boldened)
- Instability of the Light Source
- The incandescent lamp is not a perfectly stable thermal source. Its radiative intensity and spectral output can vary with filament temperature. Any fluctuation affects the amount of IR radiation (especially near 4.26 µm), leading to inconsistent sensor responses.
- Timing Error in Illumination
- Manual timing during the illumination process can introduce errors, particularly in short-duration runs (e.g., 3s or 10s). This leads to inconsistent energy input to the gas cell and affects the sensor’s voltage response.
- Residual CO₂ Accumulation Between Experiments
- After each experimental run, residual CO₂ gas may remain inside the chamber. If not properly evacuated or replaced with fresh air, the remaining CO₂ could affect subsequent measurements by causing a baseline shift or additional absorption, leading to systematic errors across experiments. This is especially prominent in the first and third experiment.
- Ambient Temperature Fluctuations
- Ambient temperature changes due to ventilation, air-conditioning, or window drafts can cause small drifts in baseline readings, affecting the voltage stability of the thermal sensor.
- Uneven CO₂ Distribution in Chamber
- Sublimated CO₂ from dry ice might not evenly distribute within the chamber. This non-uniform gas concentration results in localized IR absorption differences and inconsistent sensor outputs.
- Non-linear Response of the Thermopile Sensor
- The output voltage of the thermopile sensor is related to the temperature difference between its hot and cold junctions. However, under large temperature gradients or long illumination durations, the relationship may deviate from our assumed ideal linearity. Since the exact voltage-temperature relationship of the sensor is not precisely characterized, our assumption of linearity could be but a mere estimation.
- Incomplete Background Compensation
- While a no-illumination control group was used, if measured at a different time or under different conditions, residual background temperature and sensor noise might not be fully eliminated.
- Thermal Diffusion and Material Absorption
- The chamber materials (such as acrylic or SiO₂ slips) may absorb some infrared radiation, causing a slight reduction in the thermal energy reaching the sensor. However, the thermal absorption effect of the chamber is generally minor and should not cause significant systematic errors in the main data trends.
Current Limitations and Prospects for Improvement
While infrared absorption spectroscopy offers specificity and sensitivity in CO₂ detection, several limitations must be addressed to optimize the performance of portable sensors. Limitations:
- Cross-Sensitivity: IR-based sensors can exhibit cross-sensitivity to other gases, such as water vapor, which also absorb IR radiation in overlapping spectral regions. This interference can compromise measurement accuracy.
- Temperature Dependence: Variations in ambient temperature can affect both the IR source and the detector's response, leading to measurement drift. Without proper compensation, this can result in erroneous CO₂ readings.
- Sensor Drift: Small vibrations or displacements will cause fluctuations in measurement data. Regular maintenance and recalibration are necessary to ensure long-term reliability.
Prospects for Improvement
- Advanced Optical Filtering: Employing narrowband optical filters with high selectivity can minimize cross-sensitivity by isolating the specific absorption band of CO₂, thereby enhancing measurement accuracy.
- Temperature Compensation Mechanisms: Integrating temperature sensors and implementing real-time compensation algorithms can mitigate the effects of ambient temperature fluctuations on sensor performance.
- Self-Calibration Features: Incorporating self-calibration capabilities can address sensor drift and aging, reducing the need for manual recalibration and maintenance.
- Real-time signal acquisition and environmental compensation: Implement real-time data acquisition and signal processing algorithms that allow the sensor to deliver continuous CO₂ readings with appropriate compensation for environmental factors. This involves correcting for any baseline drifts or systematic errors (for example, due to ambient temperature fluctuations affecting the thermopile or pressure changes affecting density) and ensuring that the output is a stable, real-time indication of CO₂ concentration. By achieving this, the device will be capable of reliable field measurements, providing immediate feedback on CO₂ levels with minimal lag and robust accuracy.
Step 1:
- Prioritize the use of the Third Experiment Setup (gas cylinder + exhaust) for future experiments, as it provides the most reliable and high-precision results.
Step 2:
 System Stability Improvement:
   - Integrate LDO voltage regulator chips to stabilize electrical components.
   - Use fully shielded metal enclosures to minimize electromagnetic interference.
   - Implement dual light source differential detection to enhance light stability.
Step 3:
- Increase time resolution of data acquisition (e.g., recording every second) to improve concentration change modeling precision.
References
- Wei, P. S., Hsieh, Y. C., Chiu, H. H., Yen, D. L., Lee, C., Tsai, Y. C., & Ting, T. C. (2018). Absorption coefficient of carbon dioxide across atmospheric troposphere layer. Heliyon, 4(10), e00785. https://doi.org/10.1016/j.heliyon.2018.e00785
- Stips, A., Macias, D., Coughlan, C. et al. On the causal structure between CO₂ and global temperature. Sci Rep 6, 21691 (2016). https://doi.org/10.1038/srep21691
- Mamouei, M., Budidha, K., Baishya, N. et al. An empirical investigation of deviations from the Beer–Lambert law in optical estimation of lactate. Sci Rep 11, 13734 (2021). https://doi.org/10.1038/s41598-021-92850-4
- T.A.Vincent, B. Urasinska-Wojcik, J.W. Gardner, Development of a Low-cost NDIR System for ppm Detection of Carbon Dioxide in Exhaled Breath Analysis, Procedia Engineering, Volume 120, 2015, Pages 388-391, ISSN 1877-7058, https://doi.org/10.1016/j.proeng.2015.08.648.
- Wang, Y., Feng, Y., Adamu, A.I. et al. Mid-infrared photoacoustic gas monitoring driven by a gas-filled hollow-core fiber laser. Sci Rep 11, 3512 (2021). https://doi.org/10.1038/s41598-021-83041-2
Appendix


