CO2 Concentration Detector: Difference between revisions
| Line 86: | Line 86: | ||
|} | |} | ||
According to the ideal gas law, the corresponding number of moles can be calculated: | |||
<center><math>\large\mathbf{PV = nRT}</math></center> | |||
Thus we can get the following tables present the output voltages from the photodetector corresponding to different CO<sub>2</sub> concentrations(the volumn of the chamber is 80ml). Each voltage value represents an individual measurement, and an average is calculated from three groups. | |||
{| class="wikitable" | {| class="wikitable" | ||
Revision as of 20:51, 29 April 2025
Team Members
Zhao Yun A0295128X
Xie Zihan A0295111M
Zhang Wenbo A0307226L
Introduction
Carbon dioxide (CO2) is a critical greenhouse gas whose concentration monitoring is essential for various applications, including environmental protection, industrial process control, and indoor air quality management. One effective method for detecting CO2 concentrations relies on the molecule's specific absorption characteristics in the infrared region.
CO2 exhibits a strong absorption peak at a wavelength of 4.26 μm, which corresponds to its fundamental vibrational mode. By exploiting this property, we can design an optical detection system that measures the intensity attenuation of infrared light at this wavelength as it passes through a gas chamber containing CO2. According to the Beer–Lambert law, the degree of light absorption is directly related to the concentration of the absorbing gas, enabling quantitative analysis:
In this project, we aim to develop such a detection apparatus. The system comprises an infrared light source centered at 4.26 μm, a gas chamber, and an infrared detector. By monitoring the reduction in light intensity after it traverses the gas chamber, the CO2 concentration can be inferred. This method offers non-invasive, real-time measurement capabilities and has the potential for high sensitivity and specificity.

Procedure
The experiment aimed to quantify the CO2 concentration by monitoring the voltage output from a photodetector, which corresponds to the transmitted infrared light intensity at the characteristic wavelength of 4.26 μm. A broadband infrared light source was used, and a narrow-band filter isolated the desired wavelength. The gas chamber used for the measurements had a fixed volume of 80 mL. The procedure was as follows:
- System Setup
- A broadband infrared light source was used to emit light through the gas chamber (volume: 80 mL).
- A narrow-band optical filter centered at 4.26 μm was placed before the photodetector to ensure only light at this wavelength reached the sensor.
- A photodetector (light intensity sensor) was connected to a data acquisition system, which recorded the output voltage corresponding to the detected light intensity.

- Initial Measurement
- With ambient air (approximately 400 ppm CO2) in the gas chamber, the initial sensor output voltage V0 was measured and recorded as the baseline.
- CO2 Injection and Voltage Recording
- Controlled increments of CO2 gas were introduced into the 80 mL gas chamber, gradually increasing the CO2 concentration.
- After each increment, the output voltage V from the photodetector was measured and recorded.
- The process was repeated for multiple concentration levels to establish the relationship between CO2 concentration and sensor voltage output.
- Data Recording and Analysis
- The voltage outputs V0 (initial) and V (at each CO2 level) were systematically recorded.
- A calibration curve was plotted with CO2 concentration on the x-axis and photodetector output voltage on the y-axis, representing the detection characteristic.
Results and Analysis
At a room temperature of 21.9°C and with a gas chamber volume of approximately 80 mL, three sets of voltage measurements were taken using a multimeter under identical pressure conditions.
-
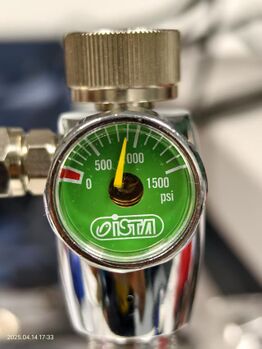 Measurement of Pressure
 -
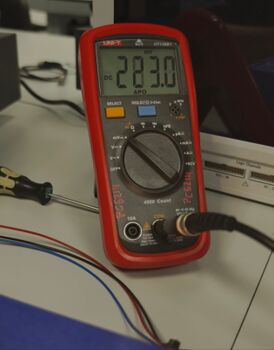 Measurement of Voltage


From the measurement we can get the following data:
| Time (s) | Cylinder pressure (psi) |
|---|---|
| 0 | 840.0 |
| 1 | 837.1 |
| 2 | 835.7 |
| 3 | 834.8 |
| 4 | 834.1 |
| 5 | 833.7 |
| 6 | 833.4 |
| 7 | 833.1 |
| 8 | 832.9 |
| 9 | 832.7 |
| 10 | 832.6 |
| 11 | 832.5 |
| 12 | 832.4 |
| 13 | 832.3 |
| 14 | 832.2 |
According to the ideal gas law, the corresponding number of moles can be calculated:
Thus we can get the following tables present the output voltages from the photodetector corresponding to different CO2 concentrations(the volumn of the chamber is 80ml). Each voltage value represents an individual measurement, and an average is calculated from three groups.
| Time (s) | CO2 (%) | Group 1 (mV) | Group 2 (mV) | Group 3 (mV) |
|---|---|---|---|---|
| 0 | 0.042 | 241.9 | 238.0 | 237.6 |
| 1 | 32 | 233.1 | 215.9 | 223.3 |
| 2 | 48 | 176.0 | 166.6 | 173.6 |
| 3 | 58 | 165.6 | 160.8 | 156.6 |
| 4 | 65 | 149.7 | 155.4 | 156.7 |
| 5 | 70 | 139.0 | 143.0 | 139.3 |
| 6 | 73 | 129.0 | 132.2 | 129.1 |
| 7 | 76 | 132.7 | 129.4 | 133.7 |
| 8 | 79 | 121.2 | 115.7 | 125.6 |
| 9 | 81 | 120.5 | 115.5 | 121.6 |
| 10 | 82 | 116.0 | 114.2 | 114.6 |
| 11 | 83 | 110.7 | 113.1 | 113.0 |
| 12 | 84 | 107.7 | 107.6 | 108.2 |
| 13 | 85 | 104.7 | 102.3 | 102.4 |
| 14 | 86 | 99.0 | 101.4 | 100.8 |
Table: Raw voltage measurements across three groups
According to the ideal gas law, the corresponding number of moles can be calculated:
where P is the pressure,V is the volume, n is the number of moles,R is the ideal gas constant, and T is the absolute temperature. In our case, T = 295K, V= 130ml (which is the volumn of the gas cylinder).
-
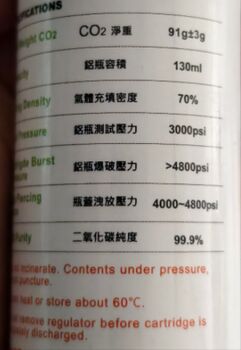 Volumn of cylinder
 -
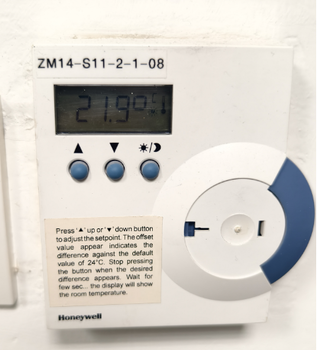 Temperature


Accorading to these above, we can calculate the exact concentartion of CO2(the air chamber's volumn is approximately 80ml), we use the averaged voltage response as a function of CO2 concentration to plot the curve:
where:
- V: output voltage (in mV)
- c: CO2 concentration (in %)

From the results presented in the figure, it can be observed that the curve exhibits an approximately linear trend, indicating that the detector output responds steadily to changes in CO2 concentration. Thus, under identical environmental conditions, the CO2 concentration can be inferred directly from the measured output voltage.
Analysis
Nonlinear Voltage Response to CO2 Concentration
The relationship between output voltage and CO2 concentration is not strictly linear. In the low concentration range (e.g., from 0.042% to around 30%), the voltage drops slowly, whereas at higher concentrations the decline becomes significantly steeper. This behavior can be attributed to the logarithmic nature of infrared absorption and the nonlinear response of the photodetector—where sensitivity increases as light intensity decreases.
System Imperfections and External Influences
Due to limitations in the experimental setup, complete gas sealing could not be achieved, potentially causing gas leakage or imperfect mixing. In addition, uncontrolled external infrared sources may have introduced optical noise into the system, affecting the sensor output. This optical interference is one of the main contributors to measurement uncertainty and reduces the system’s repeatability and precision.
Conclusion
In this project, we successfully developed a CO2 sensing system based on infrared absorption at the characteristic wavelength of 4.26 μm. By monitoring the voltage output of a photodetector and analyzing its response to varying CO2 concentrations, we demonstrated a clear and repeatable inverse correlation between gas concentration and detector output.
Although minor deviations were observed—primarily due to environmental noise, limited gas sealing, and optical interference—the overall results confirmed the system's sensitivity to CO2 levels. The fitted exponential model further validated the expected behavior derived from the Beer–Lambert law.
Despite inherent measurement uncertainties, the system reliably responded to changes in CO2 concentration, indicating the successful realization of a functional gas sensor prototype.