Non-contact Alcohol Concentration Measurement Device At NIR Spectrum
Team Member
Lim Gin Joe, Sun Weijia, Yan Chengrui, Zhu Junyi
Background
Alcohol (ethanol) is a widely used organic compound in medicine, chemical industry, food, and beverages. Rapid and accurate measurement of alcohol concentration is crucial in various industries, including food and beverage manufacturing, medical disinfection, and industrial synthesis. Existing measurement methods typically have limitations such as complexity, high equipment costs, and large measurement errors. Therefore, developing an efficient, cost-effective, and non-contact measurement method is essential.
Objective
This research proposes a non-contact alcohol concentration measurement method and infrared spectroscopy. This method measures changes in infrared light intensity transmitted through alcohol solutions, using photoelectric sensors and data fitting techniques to achieve high precision measurements.
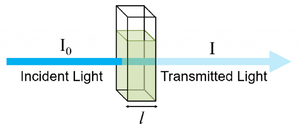
Advantages of Infrared-Based Alcohol Detection
- Non-contact measurement, reducing contamination.
- High accuracy, based on alcohol-specific infrared absorption characteristics.
- Low cost, with simple photodetection devices.
Equipment Required
- Oband Light Source: A broadband light source capable of emitting light across a spectrum of wavelengths.
- Photodetector: A device to measure the intensity of light that has passed through the sample solution.
- Alcohol Samples: Different alcohol solutions with known concentrations (e.g., ethanol, isopropanol).
- Cuvette: A transparent container to hold the alcohol solution for light transmission.
- Spectrometer: For recording and analyzing the intensity of transmitted light.
- Power Supply: To power the Oband light source.
Methodology
1. Experiment Procedures
- Preparation of alcohol solutions at concentrations of 25%, 50%, and 75%.
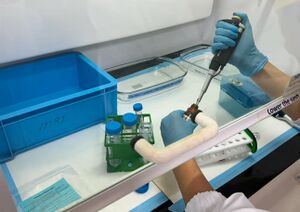
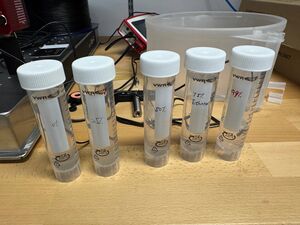
- Measurement of absorption using spectrometer.
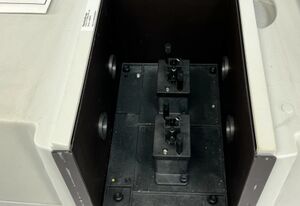
- Use Origin software for spectral normalization and baseline correction, and process the alcohol spectra at three different concentrations.
(Due to very small differences in spectral data, it is challenging for non-experts to visually distinguish spectra from the three alcohol concentrations. Therefore, apply machine learning-based Principal Component Analysis (PCA) for spectral classification, thus enabling alcohol concentration measurement.)
Data Analysis
Alcohol solutions of 25%, 50%, and 75% concentrations were measured. The measurement errors ranged from 0.3%-2.3%, with an average error around 1%. Polynomial regression was used for data fitting.
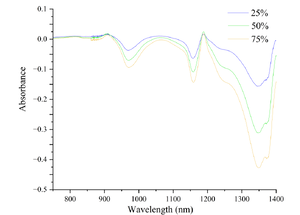
As observed from the figure, alcohol molecules exhibit specific absorption peaks at different wavelengths within the range of 800 nm to 1400 nm, and the intensity of these peaks changes notably with increasing alcohol concentration. Particularly in the wavelength range from 1200 nm to 1400 nm, absorption intensity increases significantly as alcohol concentration rises, with the peak around 1300 nm being especially pronounced. This indicates a close relationship between this wavelength range and the specific molecular vibration modes of alcohol. Moreover, subtle variations can also be observed within the 900 nm to 1100 nm wavelength range, providing additional distinguishing features for alcohol concentrations.
The absorption of infrared spectra by alcohol molecules mainly originates from different molecular vibration modes. The most prominent absorption peak arises from the stretching vibration of the O-H bond, typically occurring around 1400 nm. This vibrational mode is closely related to hydrogen bonding, causing potential slight shifts in peak positions with changing concentrations. Additionally, the stretching vibration of the C-H bond around 1200 nm also reflects changes in alcohol concentration. Furthermore, characteristic absorption peaks associated with the C-O bond of alcohol molecules occur between 900 nm and 1100 nm, related to vibrations of the molecular skeleton.
References
- Beer-Lambert Law for Spectrophotometry
- Applications of Optical Sensing for Chemical Analysis
- Practical Guide to Spectrometer Calibration