Non-contact Alcohol Concentration Measurement Device At NIR Spectrum
Team Member
Lim Gin Joe, Sun Weijia, Yan Chengrui, Zhu Junyi
Background
Alcohol (ethanol) is a widely used organic compound in medicine, the chemical industry, food, and beverages. Rapid and accurate measurement of alcohol concentration is crucial in various industries, including food and beverage manufacturing, medical disinfection, and industrial synthesis. Existing measurement methods often suffer from complexity, high equipment costs, and significant measurement errors. Therefore, developing an efficient, cost-effective, and non-contact measurement method is essential.
Literature Review
Infrared spectroscopy is an established method for the quantitative analysis of ethanol concentration due to its non-destructive, rapid, and accurate measurement capabilities. The Beer-Lambert law is commonly employed for absorbance-based concentration analysis, linking the absorbance to concentration through known absorption characteristics of molecules, although it is not directly utilized in our approach.
Previous studies have extensively explored the application of FT-IR and FT-NIR spectroscopies for ethanol measurement. Mendes et al. (2003) utilized Fourier transform near-infrared (FT-NIR) and Fourier transform Raman (FT-Raman) spectrometries combined with partial least squares (PLS) regression to determine ethanol content in fuel ethanol and beverages. Their FT-NIR model showed a relative standard error of prediction as low as 0.04%, demonstrating the technique's potential for precise ethanol quantification in complex solutions, such as beverages containing sugars (Mendes et al., 2003). Similarly, Conklin et al. (2014) demonstrated the applicability of FT-IR spectroscopy for ethanol determination in gasoline, leveraging O-H and alkane C-H absorption bands to achieve accurate ethanol measurements. Their calibration methods provided linear, reliable results consistent with actual ethanol content values, emphasizing infrared spectroscopy's robustness for quantitative chemical analysis (Conklin et al., 2014).
Advancements in spectral data analysis have significantly enhanced the accuracy and efficiency of infrared spectroscopy. Zhao and Du (2016) introduced a spectral-spatial feature-based classification (SSFC) framework combining dimension reduction and deep learning. The approach integrated balanced local discriminant embedding (BLDE) for spectral feature extraction and convolutional neural networks (CNN) for spatial feature extraction, significantly outperforming traditional spectral analysis methods in classification accuracy (Zhao & Du, 2016).
Deep learning and machine learning techniques have also emerged prominently in recent spectral feature extraction and classification studies. Wang et al. (2017) proposed a new automated spectral feature extraction method based on deep neural networks, significantly reducing computational costs compared to conventional iterative optimization algorithms. Their method successfully extracted informative and non-redundant spectral features, applicable not only to spectral classification but also defective spectra recovery (Wang et al., 2017).
These studies collectively underline the effectiveness of combining infrared spectroscopy with advanced computational techniques such as PCA and machine learning methods. PCA, particularly, has become an established technique in spectral data analysis due to its capability of reducing dimensionality while preserving significant data variance. Moreover, modern approaches such as CNN and deep learning further enhance spectral analysis by automating feature extraction and improving classification accuracy, providing an effective framework for accurately identifying ethanol concentration in complex solutions.
In short, integrating infrared spectroscopy with sophisticated computational methods offers promising avenues for precise, rapid, and non-contact ethanol concentration measurement, significantly surpassing traditional measurement techniques regarding accuracy, efficiency, and operational convenience.
Principles
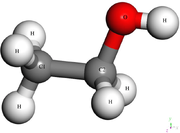
Alcohol molecules exhibit distinct absorption characteristics in the infrared spectrum due to the vibrational modes of specific functional groups, particularly the hydroxyl (-OH) and methyl (-CH₃) groups. These groups interact with infrared light at specific wavelengths, leading to unique absorption peaks that can be utilized for concentration measurement.
In the near-infrared (NIR) region, the wavelength range between 1250 nm and 1350 nm is particularly sensitive to ethanol concentration. Notably, around 1300 nm, ethanol demonstrates significant variations in absorption intensity that correlate directly with its concentration. This is primarily due to the overtone and combination vibrations of the C-H and O-H bonds, which result in measurable absorption differences as ethanol content changes.
By analyzing these absorption variations, it is possible to accurately determine alcohol concentration in a given sample. The wavelength of 1300 nm is chosen as the optimal measurement wavelength because it provides a clear and distinguishable response to ethanol concentration changes.
Objective
This experiment proposes a non-contact alcohol concentration measurement method by using infrared spectroscopy. This method measures changes in infrared light intensity transmitted through alcohol solutions, using a spectrometer and principal component analysis to achieve high precision measurements.
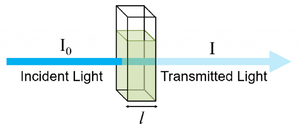
Advantages of Infrared-Based Alcohol Detection
- Non-contact measurement, reducing contamination.
- High accuracy, based on alcohol-specific infrared absorption characteristics.
- Low cost, with simple photodetection devices.
Equipment Required
- Different concentration of ethanol
- Cuvette
- LAMBDA 850 Spectrometer
The LAMBDA 850 is a high-performance UV-Vis spectrophotometer designed for precise and reliable analysis. It provides advanced optical and measurement capabilities, enabling the analysis of various samples across a broad wavelength range.
Experimental Procedures
- Preparation of alcohol solutions at concentrations of 25%, 50% and 75%.
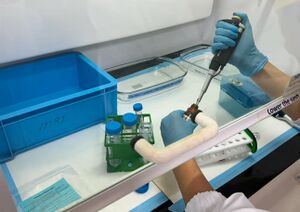
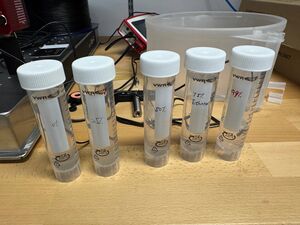
- Measurement of absorption using spectrometer.
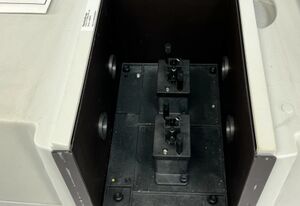
- Use Origin software for spectral normalization and baseline correction, and process the alcohol spectra at three different concentrations.(Due to the subtle differences in the spectral data, it is difficult for non-experts to visually distinguish between the spectra of the three alcohol concentrations. Therefore, machine learning-based Principal Component Analysis (PCA) is applied for spectral classification, enabling accurate measurement of alcohol concentration.)
Data Analysis
Alcohol solutions of 25%, 50%, and 75% concentrations were measured. The measurement errors ranged from 0.3% to 2.3%, with an average error around 1%. Polynomial regression was used for data fitting.
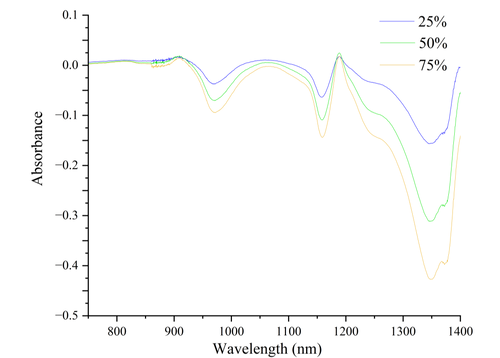
As observed from the figure, alcohol molecules exhibit specific absorption peaks at different wavelengths within the range of 800 nm to 1400 nm. The intensity of these peaks changes notably with increasing alcohol concentration. In particular, the wavelength range from 1200 nm to 1400 nm shows a significant increase in absorption intensity as alcohol concentration rises. The peak around 1300 nm is especially pronounced, indicating a close relationship between this wavelength range and the specific molecular vibration modes of alcohol.
The absorption of infrared spectra by alcohol molecules primarily originates from different molecular vibration modes. The most prominent absorption peak arises from the stretching vibration of the O-H bond, typically occurring around 1400 nm. This vibrational mode is closely related to hydrogen bonding, which can cause slight shifts in peak positions as concentration changes. Additionally, the stretching vibration of the C-H bond around 1200 nm also reflects changes in alcohol concentration. Furthermore, characteristic absorption peaks associated with the C-O bond of alcohol molecules occur between 900 nm and 1100 nm, which are related to vibrations of the molecular skeleton.
Machine Learning Optimization
Principal Component Analysis (PCA) is a widely used data dimensionality reduction technique. It starts by inputting a dataset and reducing the data dimensionality to k dimensions. After mean-centering the data, the covariance matrix is calculated, and eigenvalues and eigenvectors are obtained via eigenvalue decomposition. PCA has extensive applications in spectroscopy; by preserving the most significant directions of variation, PCA projects high-dimensional spectral data into a low-dimensional space, thereby simplifying data complexity and facilitating easier data processing.
Additionally, PCA is employed for classification or clustering analysis of spectral data. Clustering or classifying samples in principal component space helps identify similarities and differences among samples, assisting in sample categorization or identification. By analyzing the contribution of each principal component, PCA can identify the wavelengths or features most representative in spectral data, aiding feature selection for subsequent analysis.
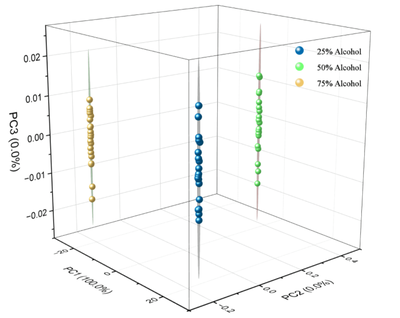
Infrared spectroscopy is used to rapidly acquire spectral data of alcohol solutions at different concentrations. This spectral data serves as the original dataset input into machine learning models for feature selection. After training and testing, these models can effectively identify alcohol concentrations. Additionally, this project aims to normalize spectral data, ensuring that all parameters are of similar magnitude, thus preventing strong peaks in high-intensity spectral lines from disproportionately affecting analysis results. This approach enhances computational efficiency and reduces analytical errors.
Conclusion and Future Improvements
To distinguish alcohol solutions of different concentrations more accurately, quantitative analysis methods can be employed. For instance, measuring absorbance at specific wavelengths (such as 1200 nm and 1300 nm) and establishing calibration curves relating absorbance to alcohol concentration allows more intuitive differentiation between varying concentrations. Additionally, employing multi-wavelength ratio methods, which compare absorption intensities at multiple selected wavelengths, can reduce background interference and further improve accuracy in alcohol concentration determination.

References
- Liu, Pingan & Liu, Junpeng & Wang, Mengjun. (2019). Adsorption of ethanol molecules on the Al (1 1 1) surface: a molecular dynamic study. Royal Society Open Science. 6. 181189. 10.1098/rsos.181189.
- Mendes, L. S., Oliveira, F. C. C., Suarez, P. A. Z., & Rubim, J. C. (2003). Determination of ethanol in fuel ethanol and beverages by Fourier transform (FT)-near infrared and FT-Raman spectrometries. Analytica Chimica Acta, 493(2), 219-231.
- Conklin, A., Goldcamp, M. J., & Barrett, J. (2014). Determination of ethanol in gasoline by FT-IR spectroscopy. Journal of Chemical Education, 91(6), 889-891.
- Zhao, W., & Du, S. (2016). Spectral–Spatial Feature Extraction for Hyperspectral Image Classification: A Dimension Reduction and Deep Learning Approach. IEEE Transactions on Geoscience and Remote Sensing, 54(8), 4544-4558.
- Wang, K., Guo, P., & Luo, A. L. (2017). A new automated spectral feature extraction method and its application in spectral classification and defective spectra recovery. Monthly Notices of the Royal Astronomical Society, 465(4), 4311-4324.